S&P 500 concentration is rising - but so is the earnings quality below the top 10



We have seen a significant shift in market leadership in 2026. Early in the year, mega-cap stocks acted as a headwind to US market performance. This was in part a consequence of the type of sectors that were outperforming at the time, industrials, materials, energy and staples – as markets showed a preference for ‘Heavy Asset, Low Obsolescence’ (HALO) stocks that offered some diversification to the AI theme and avoided some of the key concerns associated with weakness in the software sector.
On top of this, a valuation gap between small/mid cap stocks relative to large caps had emerged at the end of 2025, and with increasing concern surrounding index concentration, markets rotated firmly away from the largest stocks in the index.
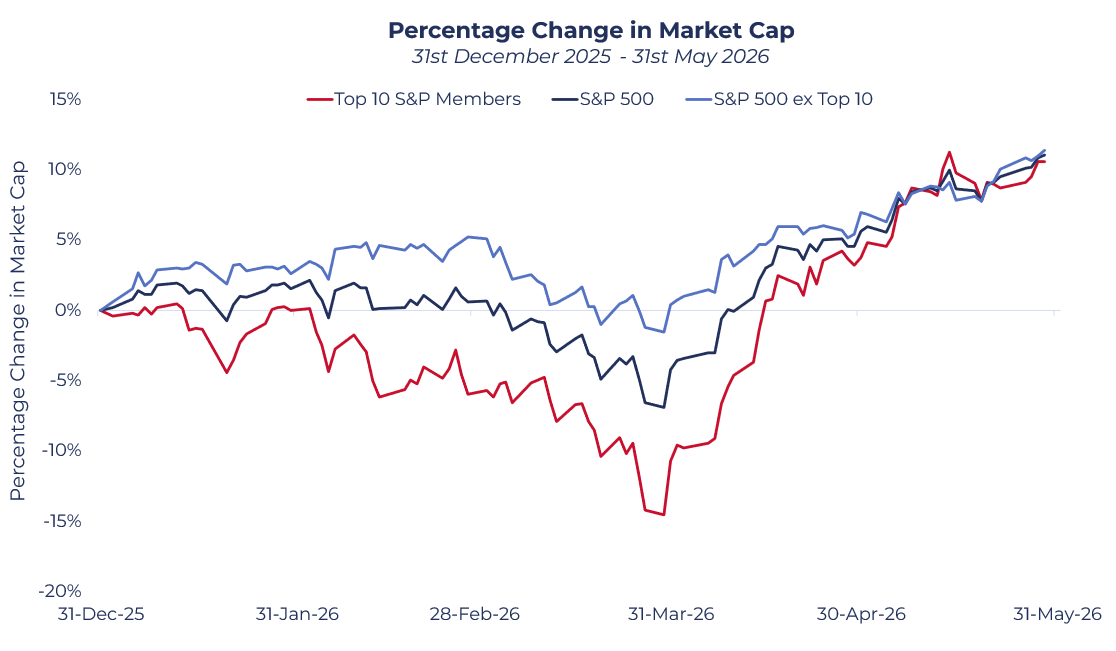
Up until 30 March, the S&P 500 saw its market cap contract 6.9%, but most of the decline came from its biggest members. Stripping out the ten largest stocks (in terms of market cap on 31 December 2025), the rest of the index was down just 1.6%.
Source: Guinness Global Investors, 31 May 2026
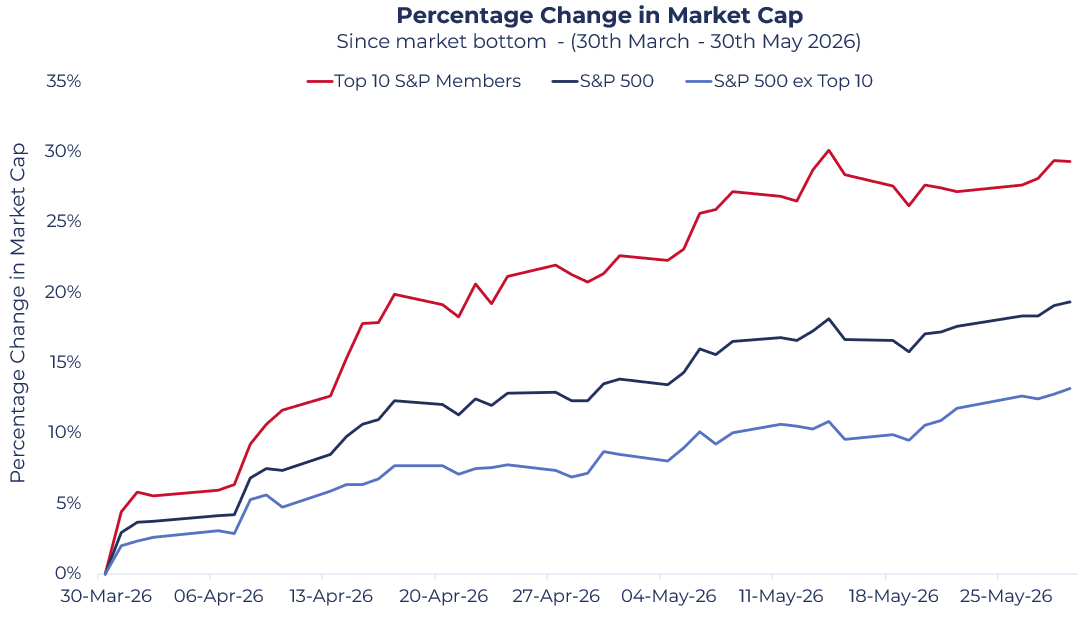
This has completely reversed since the market bottom on 30th March. Easing tensions in the Middle East have somewhat facilitated a rotation away from more defensive positions and back into growth names, with renewed enthusiasm surrounding ‘picks and shovels’ AI stocks in particular.
As can be seen in the chart below, the S&P 500’s return has been driven by a relatively narrow selection of stocks: The ten largest stocks in the index (as of 31 December 2025) have seen their market cap grow 29%, against roughly 19% for the index as a whole, and only 13% for the index when excluding them.
Source: Guinness Global Investors, 31 May 2026
S&P 500 Concentration is rising again - but it is backed by earnings
The return of mega cap outperformance brings us back to a recurring debate over the past two to three years: rising index concentration. Index concentration levels have continued to rise, as mega-caps have continued to outperform and deliver extraordinary profit growth.
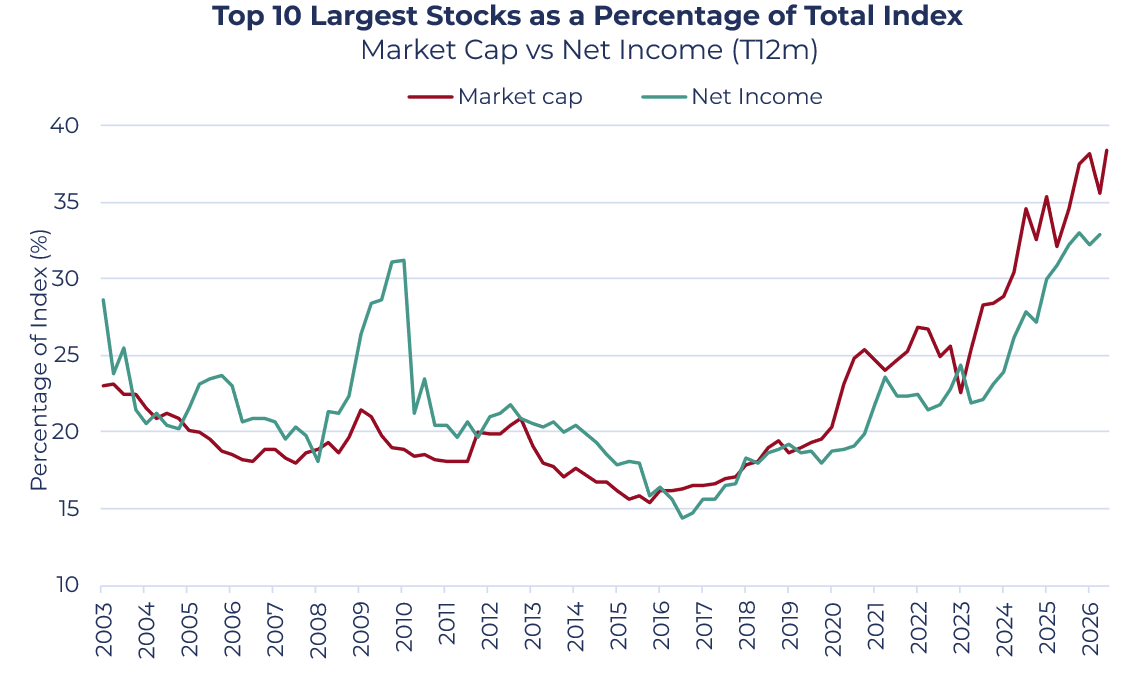
The ten largest US companies now generate around a third of the entire index’s net income, double what we saw back in 2015–16.
How does this differ from index concentration during the financial crisis?
There was a similar spike during the financial crisis, when the top ten briefly accounted for one-third of the index’s reported profits, but this occurred for different reasons.
The ‘rest’ of the index’s earnings had collapsed under bank write-downs, leaving the market leaders’ share to increase by default. This time it is the opposite: the largest companies’ share is rising because they are growing earnings at a rate faster than the rest of the market.
Both market value and profit share are rising
The top ten’s share of the index’s market value (red in the chart below) and their share of its profits (in green) have risen broadly in step over time. In other words, the rising market cap concentration of these companies has, for the most part, been matched by their earnings. This is not simply a case of investors paying ever-higher multiples for the same profits – this is market cap growth fuelled by profit growth.
Bears may point out that market value share has edged slightly ahead of earnings share, meaning a degree of optimism about future growth is now priced in. But, in recent years, this has typically preceded a rise in earnings share. Overall, the gap is small, and the chart should reassure markets that rising concentration is, at least somewhat, rational.
Source: Guinness Global Investors, 31 May 2026
The premium has remained stable since 2023 for the Top 10 stocks
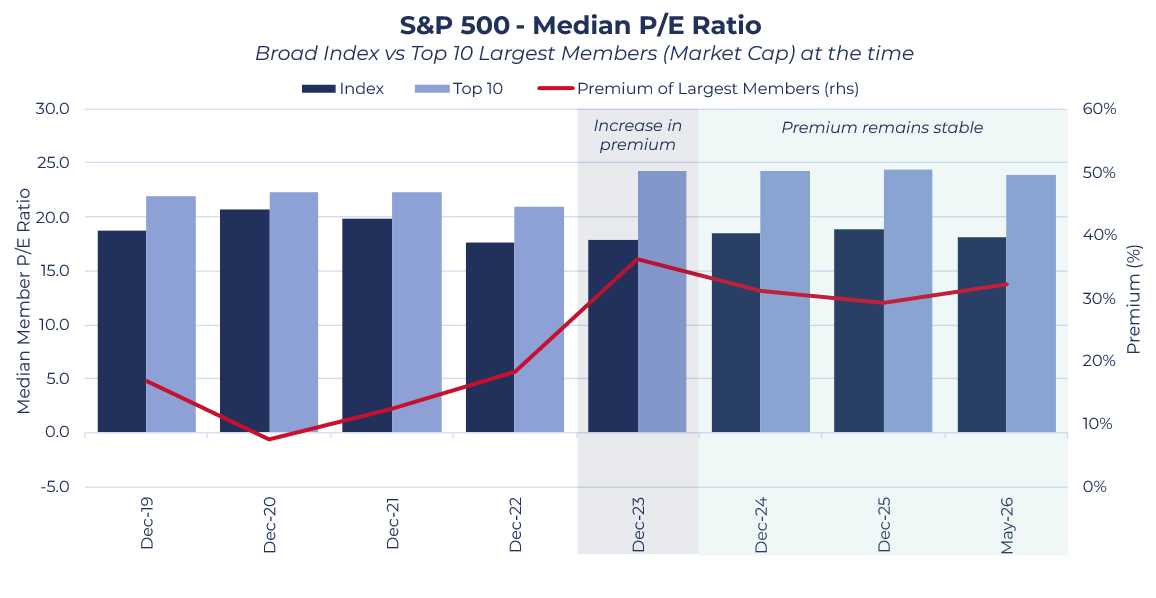
In our concentration risk insight, we saw a sharp rise over 2023 in the premium of the top 10 largest S&P 500 members (by market cap, measured at each individual data point) vs the rest of the index. There was a corresponding rise in index concentration. But since December 2023, there has been very little change in P/E (median member) in both the index and the top 10 largest constituents.
More importantly, and somewhat obviously given the previous statement, there has been no change in the premium. This suggests that rising concentration levels since 2023 are not a consequence of P/E multiple expansion, but a superior rate of earnings growth from these top 10 companies. It is important to highlight that eight of the top ten constituent stocks, between December 2023 and May 2026, are the same.
Source: Guinness Global Investors, 31 May 2026
How dependable is this earnings growth?
The market’s key concern is this: if an increasingly large share of market returns comes from a small number of companies, then the index becomes more dependent on those companies continuing to deliver. With EPS growth expected to accelerate in the short term, concerns over concentration are leading markets to question where this growth is coming from and how sustainable it is.
How reliable are earnings forecasts?
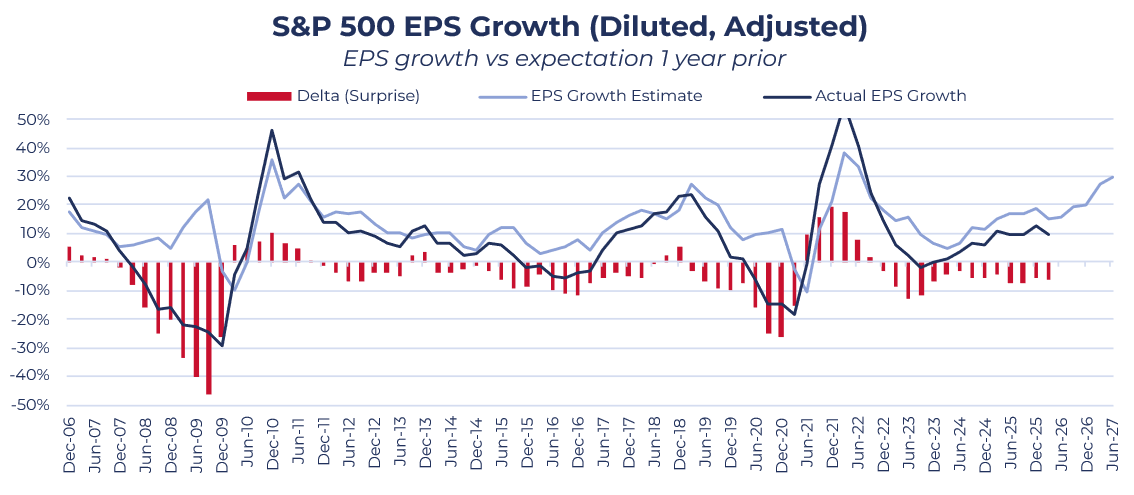
Before looking at where earnings come from, it is worth asking how reliable earnings forecasts are in the first place. The chart below compares actual EPS growth with the growth analysts had expected a year earlier. Three things stand out. First, forecasts are persistently too optimistic: since 2005, expected one-year growth has averaged c.13%, against actual growth of c.7% (post the Great Financial Crisis, the average expectation is 13% vs 10% achieved). Analysts consistently expect more than companies have been able to deliver.
Second, forecasts tend to miss the major ‘black swan’ events altogether; neither the financial crisis nor the pandemic was reflected in analyst expectations.
Third, and encouragingly, forecasts are usually right about the direction of growth, even when they are wrong about the magnitude. In short, the market tends to know which way earnings are heading, but is consistently too hopeful about how far.
Source: Guinness Global Investors, 31 May 2026
How should we try to measure index concentration?
EPS gives a useful headline figure, but is difficult to manipulate when analysing concentration. Index-level EPS is built using an ‘index divisor’, which adjusts the index EPS value for share issuance, buybacks and changes in index membership. This aggregation method makes it very difficult to isolate how much of the index's earnings come from any one company or group.
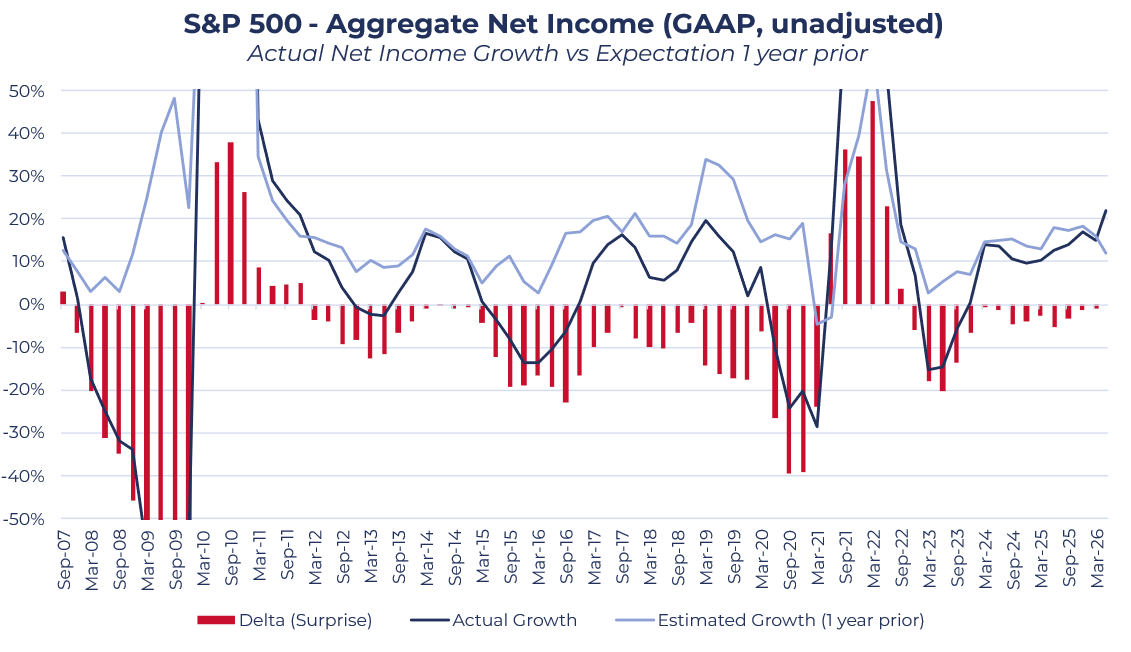
A good proxy is looking at aggregate net income – the sum of net income of all constituents in the index. The key benefit is that it can be split cleanly into different segments, in our case, the top 10 largest companies (measured by market cap, on each date of measurement), and the rest of the index.
This measure has some additional benefits. The index EPS can move for reasons that have nothing to do with how much companies actually earn, such as the impact of share buybacks. Aggregate net income moves only with actual profit, making it a more direct read on the underlying profit cycle.
As seen in the chart below, the general trend between the two measures is similar, suggesting this is a good proxy for EPS growth. The familiar pattern of over-optimism is still there: historically, the index has grown its profits more slowly than forecast. Another key observation is how small the ‘misses’ to expectations have been in recent periods. Profits have, relative to history, been closer to what the market has been expecting of them.
Source: Guinness Global Investors, 31 May 2026
The top 10 stocks are carrying the index
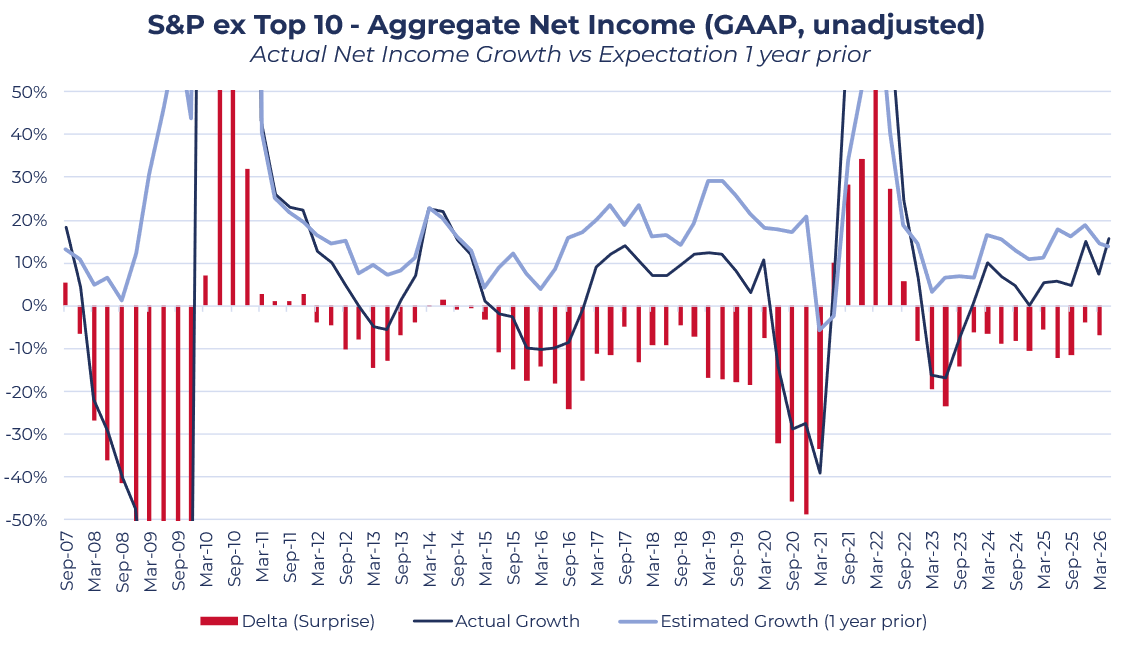
The more interesting question is whether that reliability is evenly spread across the index. If we repeat the exercise for the index excluding its ten largest companies, the chart looks almost identical at first glance; the overall shape of actual-versus-expected growth is much the same.
Source: Guinness Global Investors, 31 May 2026
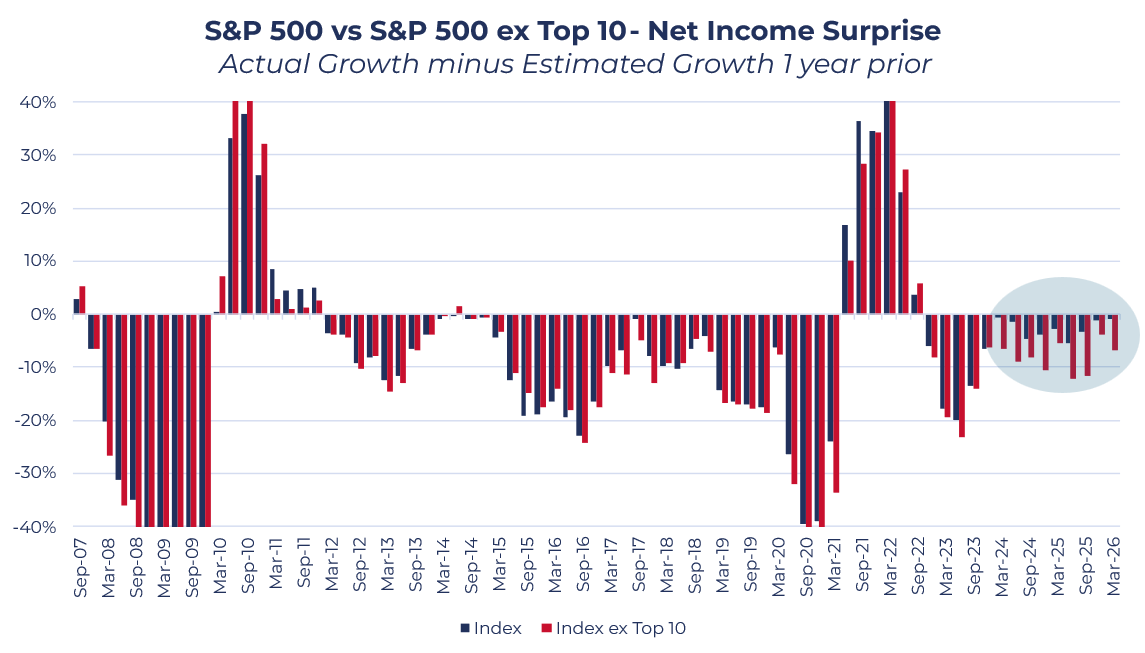
Plotting the two ‘surprises’ (red bars) together helps to identify the key difference. For most of the past twenty years, leaving aside the financial crisis, the index and the index-ex-top-ten missed or beat investor forecasts (‘beat’) by similar amounts.
Over the past few years, these measures have pulled apart. The rest of the index has been missing forecasts by a noticeably wider margin than the index, suggesting the ten largest companies are ‘flattering’ the headline number. However, as we will discuss in further detail, there have been recent signs that this is slowly broadening as the ex-top-ten share of the index has started to contribute more to net growth.
Source: Guinness Global Investors, 31 May 2026
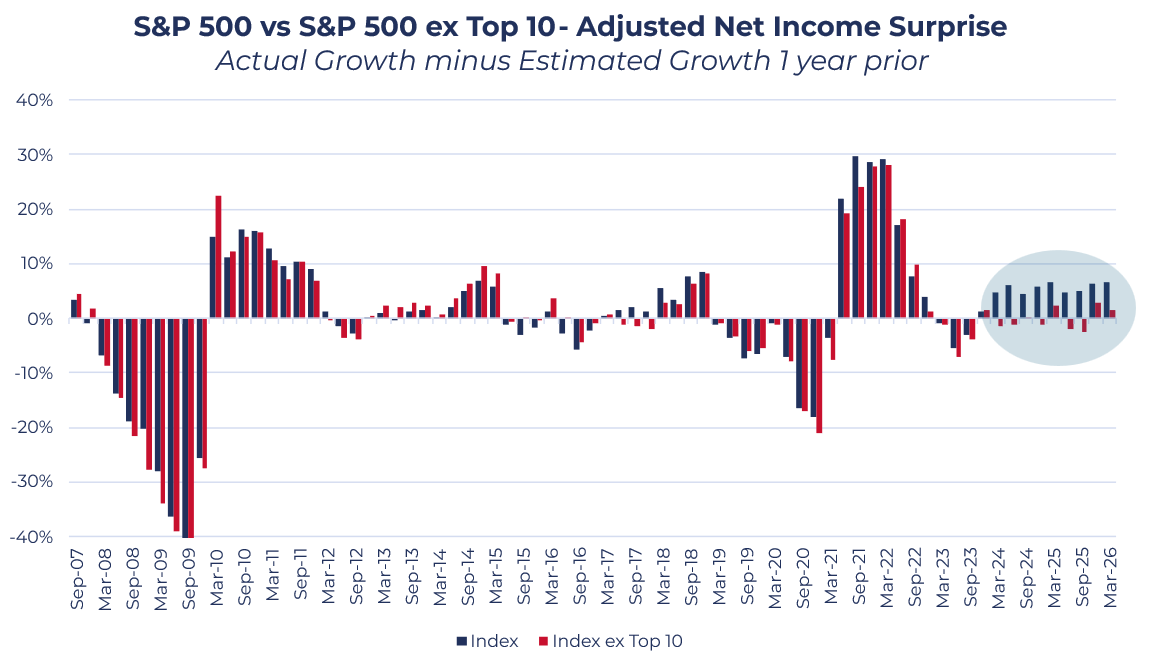
Using adjusted net income figures, the market appears to have a better track record at predicting performance. Still, a similar trend emerges. For the past twenty years, the two groups have largely beat or missed by similar amounts. Since December 2023, however, we have seen significant beats for the index as a whole, but only in-line performance when excluding the top-10.
Source: Guinness Global Investors, 31 May 2026
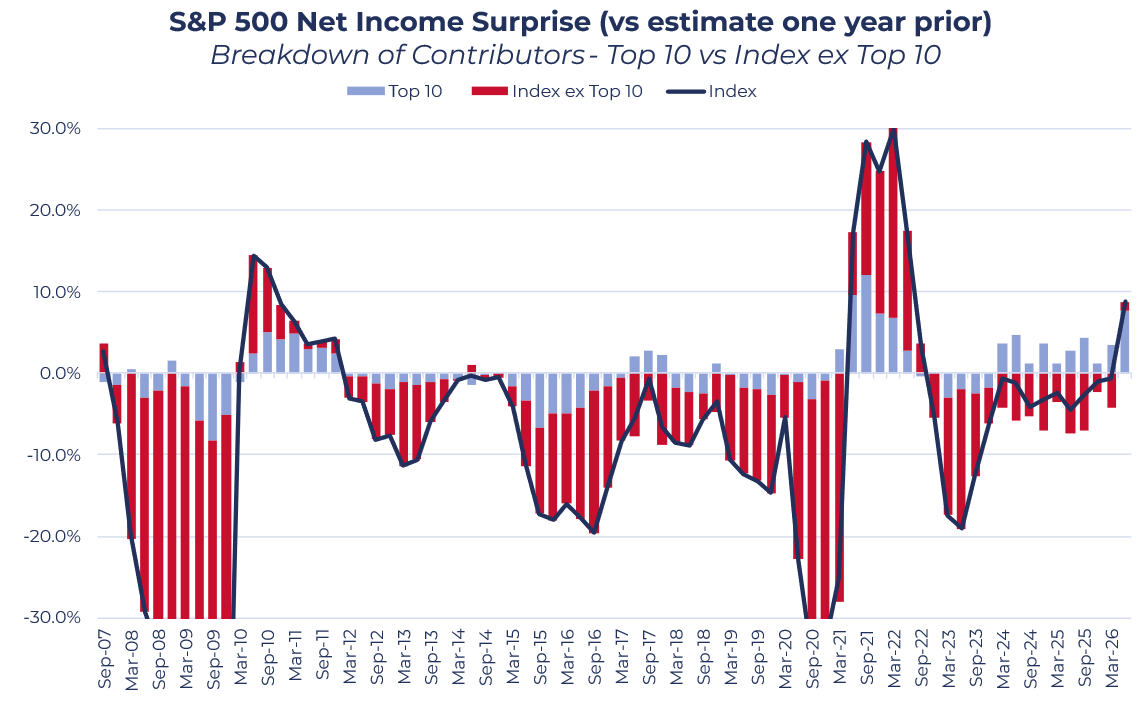
We can disaggregate the contribution of the ‘top 10’ companies from the rest of the index, in order to identify each group's contribution to earnings surprise. Since the end of 2023, the ten largest companies have beaten net income (GAAP) expectations in almost every quarter.
Over the same period, the rest of the index has missed in almost every quarter, until the most recent reading. For more than three years, the index’s ability to beat forecasts has come almost entirely from its ten largest members. This is perhaps the clearest evidence that the concentration is justified by fundamental performance rather than sentiment.
The largest companies are not simply a bigger share of the index in terms of earnings; they are also the part of the index that has consistently done better than expected.
Source: Guinness Global Investors, 31 May 2026
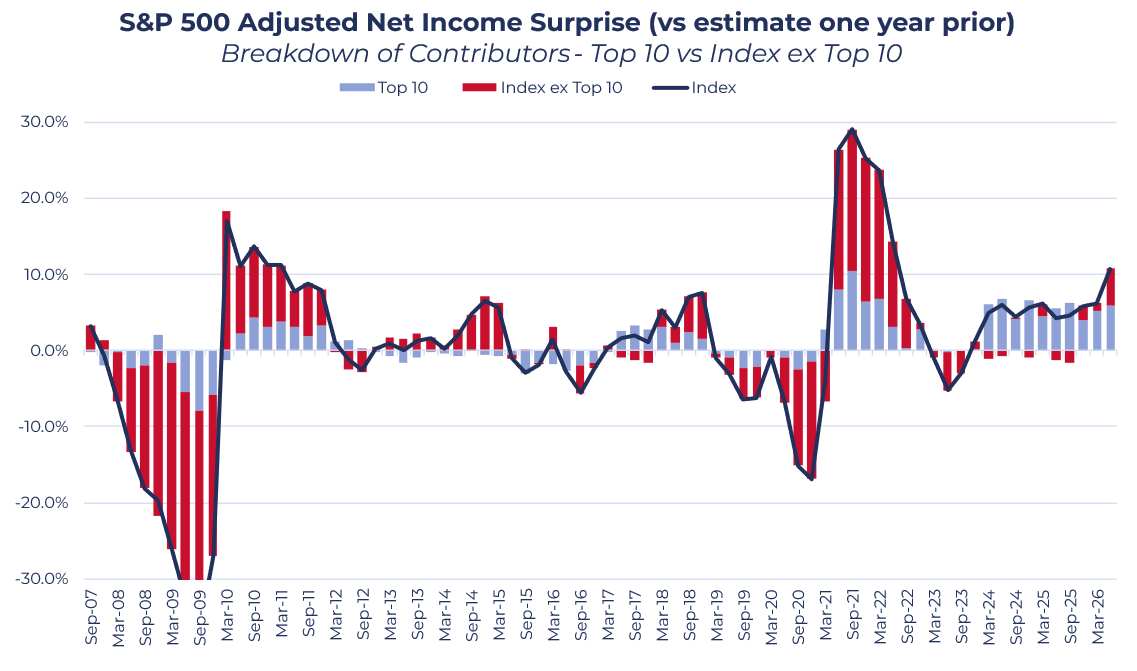
Markets tend to react to adjusted net income, the figure companies report after stripping out items they regard as one-off, rather than the GAAP number, because that is what analysts tend to base forecasts on. It therefore makes sense to run the same analysis on an adjusted basis.
On an adjusted basis, performance since December 2023 suggests that nearly the entirety of index beats have come from the ten largest companies, with the rest of the index only recently contributing positively.
Source: Guinness Global Investors, 31 May 2026
Signs of a broadening market
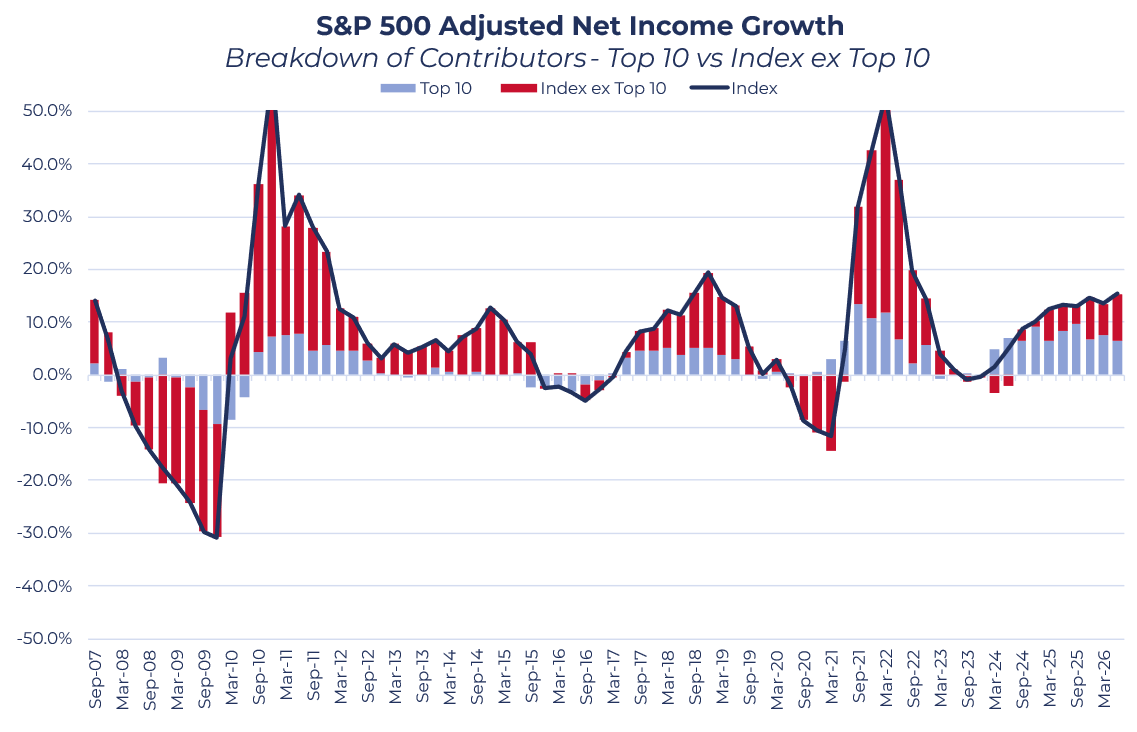
The same analysis can be applied to net income growth itself, rather than to surprises. The first thing to note is that the contribution from the top ten, whilst large, is not unusual; the largest companies have driven this level (c.4%) of the index's growth, for sustained periods, before.
What is different this time is the backdrop: usually, a contribution of this size comes alongside strong, broad growth from the rest of the index, whereas here, the rest of the index has contributed less than the majority of growth. Encouragingly, this is starting to change. The rest of the index has been contributing more with each passing quarter, indicating a broadening market.
Source: Guinness Global Investors, 31 May 2026
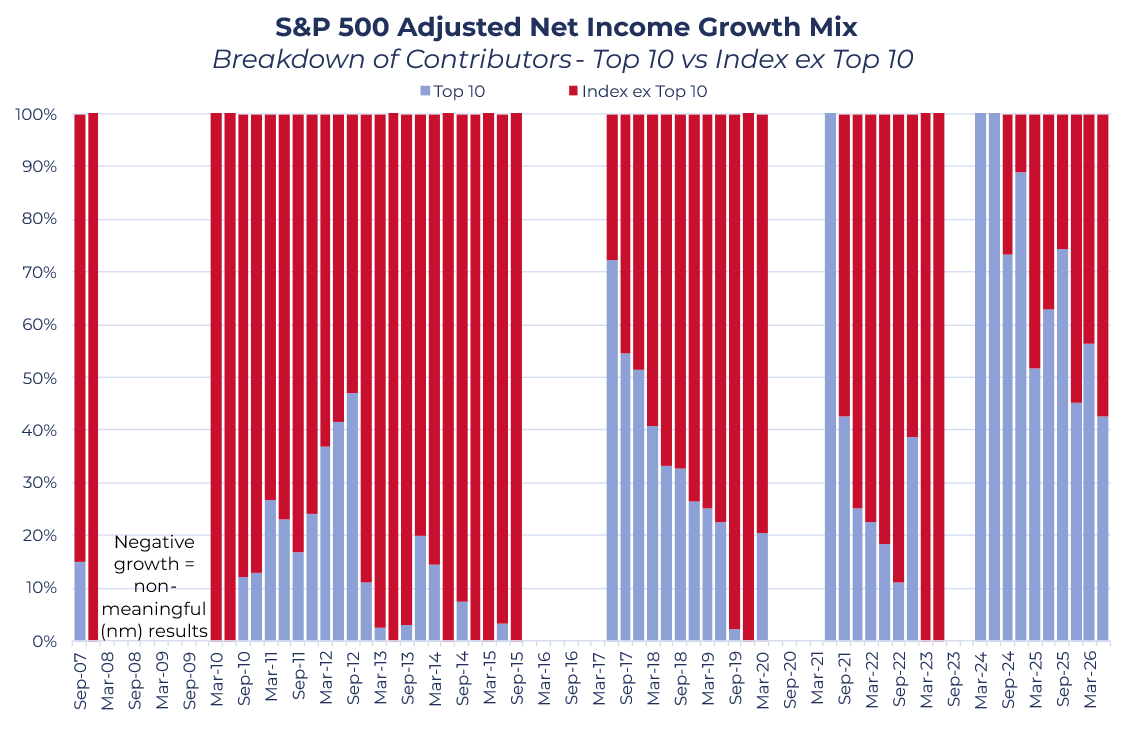
Perhaps an easier way to frame this idea is by analysing the mix of the growth contributors, rather than the absolute magnitude. The final chart looks at the mix of growth in the quarters (only when the index’s profits were rising, otherwise the results are not meaningful) – in other words, the share of growth coming from the top ten versus the rest of the index.
There are two key observations. The first is just how dominant the largest companies have been on a relative basis for such a sustained period of time. Pre-2024, the top 10 companies rarely delivered consecutive quarters of more than 50% growth contribution. In fact, their average contribution in positive growth markets was c.21% (assuming a max contribution of 100% in periods where the rest of the index was growing negatively).
In the most recent period, the average contribution has been c.70%. This has clearly been an exceptional period of mega-cap dominance. The second observation is more encouraging: that dominance has started to fade. From its 2024 peak, the share of growth coming from the top ten has fallen back towards half through 2025 and into 2026, as the rest of the index has begun to contribute again. The level of concentration remains very high, but the growth that drives it is starting to come from a wider range of companies.
Source: Guinness Global Investors, 31 May 2026
Concluding Thoughts
Rising concentration is the concern most often raised about the US market, but the evidence here suggests it is, for now, a rational one. The dominance of the largest companies has been built on a genuinely superior rate of earnings growth rather than on ever-higher valuations; their share of index profits has risen broadly in step with their share of its market value; their multiples have barely moved since 2023; and they have delivered consistently against expectations while the rest of the index has lagged.
The level of concentration remains high, but its source is starting to broaden, driving a higher quality, earnings-led market rally. If this continues, it would gradually reduce the market's reliance on its largest members and put the next leg of earnings growth on a wider, more durable footing.
For now, whilst index concentration is at an all-time high, we can take comfort from the fact that this is being driven by underlying earnings strength rather than irrational multiple expansion, and the fact that the rest of the index is increasingly contributing to earnings growth. The question for the year ahead is whether the rest of the market can continue to contribute more positively to the overall growth mix, and for how long.
One of the core principles of the Guinness Global Equity Income and Guinness Global Innovators Funds is their equal-weighting philosophy, in which the Funds hold each portfolio holding to an equal weight of around 3%, spread across the global market and focused on quality and value. Learn more about the wider Guinness investment philosophy here.
Disclaimer: This insight may provide information about Fund portfolios, including recent activity and performance and may contains facts relating to equity markets and our own interpretation. Any investment decision should take account of the subjectivity of the comments contained in this insight. This insight is provided for information only and all the information contained in it is believed to be reliable but may be inaccurate or incomplete; any opinions stated are honestly held at the time of writing but are not guaranteed. The contents of this insight should not therefore be relied upon. It should not be taken as a recommendation to make an investment in the Funds or to buy or sell individual securities, nor does it constitute an offer for sale.