WS Guinness Global Energy Fund
The Guinness Global Energy strategy seeks capital growth through exposure to global energy markets.
Overview
The Guinness Global Energy strategy seeks capital growth through exposure to global energy markets.
We believe that over the next twenty years the combined effects of population growth, developing world industrialisation and diminishing fossil fuel supplies will force energy prices higher.
The world's population is growing at a rate of 1% per year and is projected to rise over the next 20 years by 1.5 billion people. Over 90% of this growth will come from developing countries. The implications for energy consumption are profound. In China and India, among the world's largest and fastest-growing economies, growing demand for electricity, cars and consumer goods will have a significant impact on the world's energy balance.
The rise in global energy demand is projected to continue long into the future. And it is highly likely that the majority of this demand will be met by mainstream energy sources like oil, natural gas and coal, supported by growth in renewable technologies.
Meanwhile, the risk that energy supplies fall short of what is required over the next few years is intensifying as, in particular, the era of low-cost, easily extractable oil comes to an end. The non-OPEC world, despite the success of shale oil in the US, struggles to grow production consistently. Any spare production capacity that OPEC countries may have today is likely to decline quickly as they respond to the expected rise in demand and shortfalls caused by events such as civil war or sanctions. Put simply, the oil industry faces a huge challenge to build up new supplies of oil to compensate for the rapid decline in existing fields.
The combination of growing demand and supply challenges signals that energy prices will move up over time. This would create a favourable environment for companies with energy reserves and for their service providers and distributors.
Investment Team
High quality funds are run by high quality people.
We are proud of our collegial culture, with teams across the business benefiting from each other’s expertise as they target long-term returns for investors.


How to Invest
We aim to make it simple to invest in our funds. All our funds are open to direct investment via an application form. They are widely available on investment platforms and are eligible for UK investors’ ISAs and SIPPs.

Investment Case
Our stock selection is driven 50% by our top-down (macro) views and 50% by bottom-up stock analysis.
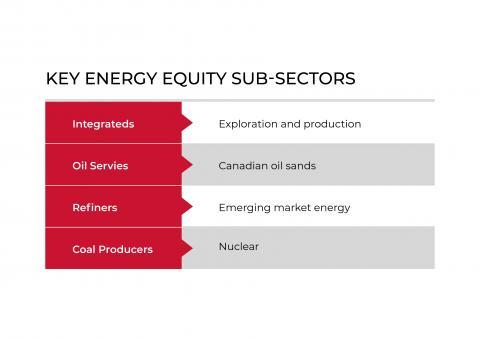
Rigorous independent analysis of the fundamental drivers of energy markets (e.g. oil supply and demand; OPEC behaviour; natural gas supply and demand; global LNG market; thermal and met coal markets). This allows us to forecast energy commodity prices and creates our top-down view, which in turn informs our energy sub-sector allocation.
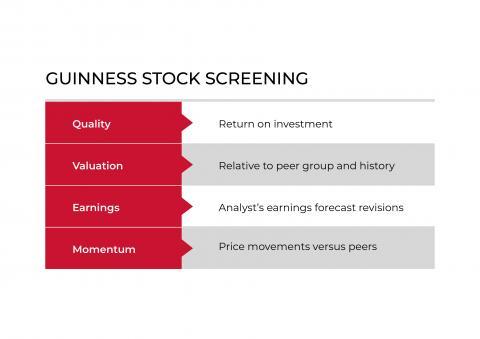
Stock ideas are derived from a disciplined stock screening process. We review a universe of around 370 energy stocks each week to identify companies which look attractive on valuation, return on investment, earnings sentiment, and price momentum. Other screens specific to certain sub-sectors are also employed. Due diligence is performed on our stock ideas to establish whether we have conviction to include the stock in our portfolio. The due diligence centres around detailed financial modelling.
The portfolio comprises 30 'best ideas' and does not follow any benchmark in its sub-sector weights, such as to ‘super-majors’. The portfolio is liquid, with 90% of the Fund normally invested in companies with a market capitalisation over US $1 billion.
In brief: why invest in energy?
In brief: why invest in energy?
Energy demand
Population growth and rising global wealth are driving relentless growth in the consumption of energy.
Energy supply
Despite improvements in alternative energy supplies, fossil fuels will remain the predominant world energy source for decades to come. However, the era of easily accessible, low-cost oil is over.
Energy company profits
Rising demand and depletion of low-cost energy supplies will push energy prices higher. This will create a favourable environment for companies with resource reserves, as well as their service providers and distributors.
Energy & inflation
Energy prices are a significant driver of inflation, which makes energy companies a useful long-term inflation hedge. If we see dollar inflation of 30-50% over the next decade (that’s just 2.7-4.3% per year), it will be surprising if oil and gas prices do not rise by a comparable percentage.
In detail: Energy Investment Case
“More motor vehicles will be sold over the next 20 years than have been sold in the entire history of the automobile industry.”
Supply is struggling to keep pace
High oil and natural gas prices between 2006 and 2014 incentivised energy companies to invest in new technologies, resulting in strong natural gas and oil production from unconventional shale resources in North America. This growth caused a change of production strategy from OPEC at the end of 2014, and this has led to sharply lower oil prices as OPEC grows production and defends market share while North American production starts to slow. We believe that OPEC is now producing near maximum capacity, while non-OPEC production will decline in the future as a result of lower investment levels. The industry still faces a big challenge in delivering reasonable oil supply growth at reasonable prices.
Favourable environment for investing in energy
The combination of growing demand and inadequate future supply signals that oil and other energy prices will move up over time. This would create a very favourable environment for companies with energy resources and for their service providers and distributors.
The Guinness Global Energy Fund seeks to capitalise on this energy price environment. We keep coming back to one key proposition: easily extractable oil and gas assets remain scarce, and it seems reasonable to believe that, as they get scarcer, they will trade at higher prices than we have yet seen. We believe shareholders in energy companies that are part of that world will be duly rewarded.
Surging demand for energy from developing countries
The world's population is growing at a rate of 1% per year, and is projected by the UN to rise by a further 20% (1.5 billion people) by 2030. Over 90% of this growth will come from developing countries. The implications for energy consumption are profound.
More motor vehicles will be sold over the next 20 years than have been sold throughout the entire history of the automobile industry. The surge of demand for electricity, cars and consumer goods in emerging markets will have a significant impact on the world's energy balance. China’s demand for oil per capita has not yet reached that of the OECD in 1950. There are 20 years of unrelenting oil demand growth to come as China’s vehicle fleet moves from 100 million now to 400 million by 2030, with numerous other countries following behind.
The rise in global energy demand is projected to continue long into the future. It is likely that the majority of this demand will be met by mainstream energy sources like oil, natural gas and coal.
The world’s oil consumption currently stands at around 94 million barrels per day, and continues to reach new highs each year. Even in the global recession of 2008/09, demand for oil from emerging markets continued to grow. We think that, over the next 10 years, global oil demand growth of 10-15 million barrels per day is highly plausible.

Investment process
Our stock selection is driven 50% by our top-down (macro) views and 50% by bottom-up stock analysis. The top-down views shape our energy sub-sector allocation, whilst bottom-up analysis is designed to identify the best stocks to populate our sub-sector allocation. The investment team applies a mixture of value and growth investing, with a bias towards value.
Top-down views
Rigorous independent analysis of the fundamental drivers of energy markets (e.g. oil supply and demand; OPEC behaviour; natural gas supply and demand; global LNG market; thermal and met coal markets). This allows us to forecast energy commodity prices and creates our top-down view, which in turn informs our energy sub-sector allocation.
Bottom-up stock screening
The team operates a disciplined stock screening process. We review a universe of around 370 energy stocks each week to identify companies which look attractive on valuation, return on investment, earnings sentiment, and price momentum. Other screens specific to certain sub-sectors are also employed to generate ideas.
Stock due diligence
Stock ideas are taken from our screens and due diligence is performed to establish whether we have conviction to include the stock in our portfolio. The due diligence centres around detailed financial modelling.
Portfolio Construction
Concentrated portfolio
The portfolio comprises 30 equally-weighted positions. Most of the positions comprise a single stock but a few are split across more than one stock, giving the portfolio 40-45 stocks in total. Our portfolio construction, with a fixed number of positions, is designed to create the best balance between maintaining fund concentration and managing stock-specific risk. It also imposes a structural sell discipline: an existing position must be sold to purchase a new holding.
Sector weights
The Fund does not follow any benchmark in its sub-sector weights. In particular, there are no underweight restrictions; the “super-major” oil and gas sector weighting may be zero.
Portfolio Risk Controls
Stock specific risk
Stock specific risk in the energy sector tends to be higher than the broader market. Our portfolio is designed to avoid excessive exposure to any individual stock.
Emerging market exposure
Normal practice is that emerging market exposure (considered by listing and by underlying asset exposure) is limited to 20% of the Fund.
Liquidity
The portfolio is liquid, with 90% of the Fund normally invested in companies with a market capitalisation over US $1 billion.
Currency
The Fund is not hedged from a currency perspective. However, because the underlying investments have an exposure to energy commodity prices, this tends to act as a natural hedge against currency movement.
Factsheets
| Fund | English | French | German | Spanish | Italian |
|---|---|---|---|---|---|
| WS Guinness Global Energy Fund | Download |
Updates
KIIDS
| Fund | Class | ISIN | English | French | German | Spanish | Italian | Swedish | Finnish |
|---|---|---|---|---|---|---|---|---|---|
| WS Guinness Global Energy Fund | I ACC GBP | GB00B56FW078 | Download |
Documents
Fund Facts
For information on the Fund’s current investments, please see the latest factsheet available on the literature tab above.
Will Riley
Tim Guinness
Share Classes
For full information on the share classes available for investment please refer to the Key Investor Information document.
Share Prices
The Funds are priced every working day at 12.00 UK time and updated here the following day.
| Fund name | Isin | Fund price | (+/-) | Date |
|---|---|---|---|---|
| GUINNESS CHINA RMB INCOME FUND CLASS Y CNH DIST | IE000026G6J3 | 99.8641 | -0.0006 | 08/05/2025 |
| GUINNESS CHINA RMB INCOME FUND CLASS Y EUR DIST | IE000K4N4BW3 | 9.0261 | 0.0445 | 08/05/2025 |
| GUINNESS CHINA RMB INCOME FUND CLASS Y GBP DIST | IE000G9JHZF4 | 8.6139 | 0.0109 | 08/05/2025 |
| GUINNESS CHINA RMB INCOME FUND CLASS Y USD DIST | IE000FIQDRV0 | 9.6208 | -0.0288 | 08/05/2025 |
| GUINNESS CHINA RMB INCOME FUND CLASS F EUR DISTRIBUTION | IE0006534FS5 | 9.0545 | 0.0448 | 08/05/2025 |
| GUINNESS CHINA RMB INCOME FUND CLASS F GBP DISTRIBUTION | IE000K9NODM9 | 8.6445 | 0.0111 | 08/05/2025 |
| GUINNESS CHINA RMB INCOME FUND CLASS F USD DISTRIBUTION | IE000BEWEDQ4 | 9.6536 | -0.0289 | 08/05/2025 |
| GUINNESS CHINA A SHARE FUND CLASS C GBP ACC | IE0006BWJJW3 | 6.6848 | 0.0599 | 08/05/2025 |
| GUINNESS CHINA A SHARE FUND CLASS C EUR ACC | IE0001VD9PN1 | 7.0011 | 0.0881 | 08/05/2025 |
| GUINNESS CHINA A SHARE FUND CLASS C USD ACC | IE0005HP3H50 | 7.4703 | 0.0351 | 08/05/2025 |
| GUINNESS CHINA A SHARE FUND CLASS I USD ACC | IE000IQ9D569 | 7.6502 | 0.036 | 08/05/2025 |
| GUINNESS CHINA A SHARE FUND CLASS Y GBP ACC | IE000I0OL207 | 6.8459 | 0.0615 | 08/05/2025 |
| GUINNESS CHINA A SHARE FUND CLASS Y EUR ACC | IE000RSR0322 | 7.1696 | 0.0903 | 08/05/2025 |
| GUINNESS CHINA A SHARE FUND CLASS Y CNH ACC | IE0002QAMMW4 | 79.3473 | 0.6125 | 08/05/2025 |
| GUINNESS CHINA A SHARE FUND CLASS Y USD ACC | IE000JCEKTR0 | 7.6502 | 0.036 | 08/05/2025 |
| GUINNESS CHINA A SHARE FUND CLASS F GBP ACCUMULATION | IE0003ZZUKD7 | 6.9265 | 0.0623 | 08/05/2025 |
| GUINNESS CHINA A SHARE FUND CLASS F EUR ACCUMULATION | IE0001MJJCX1 | 7.248 | 0.0916 | 08/05/2025 |
| GUINNESS CHINA A SHARE FUND CLASS F USD ACCUMULATION | IE000RSN6JG6 | 7.7404 | 0.0367 | 08/05/2025 |
| GUINNESS GLOBAL EQUITY INCOME FUND CLASS D USD DISTRIBUTION | IE00B3QG6N78 | 23.5402 | -0.1053 | 08/05/2025 |
| GUINNESS GLOBAL EQUITY INCOME FUND CLASS C USD DISTRIBUTION | IE00B42XCP33 | 21.9376 | -0.0985 | 08/05/2025 |
| GUINNESS GLOBAL EQUITY INCOME FUND CLASS C GBP DISTRIBUTION | IE00B3PB1722 | 25.8228 | -0.0053 | 08/05/2025 |
| GUINNESS GLOBAL EQUITY INCOME FUND CLASS D EUR DISTRIBUTION | IE00B66B5L40 | 28.0701 | 0.0975 | 08/05/2025 |
| GUINNESS GLOBAL EQUITY INCOME FUND CLASS Z GBP DISTRIBUTION | IE00B754QH41 | 30.9136 | -0.0054 | 08/05/2025 |
| GUINNESS GLOBAL EQUITY INCOME FUND CLASS C EUR ACCUMULATION | IE00BGHQF631 | 28.1521 | 0.0975 | 08/05/2025 |
| GUINNESS GLOBAL EQUITY INCOME FUND CLASS C GBP ACCUMULATION | IE00BVYPNV92 | 25.2428 | -0.0052 | 08/05/2025 |
| GUINNESS GLOBAL EQUITY INCOME FUND CLASS C USD ACCUMULATION | IE00BVYPNW00 | 22.4817 | -0.1009 | 08/05/2025 |
| GUINNESS GLOBAL EQUITY INCOME FUND CLASS Y EUR ACCUMULATION | IE00BVYPNZ31 | 23.3673 | 0.0815 | 08/05/2025 |
| GUINNESS GLOBAL EQUITY INCOME FUND CLASS Y EUR DISTRIBUTION | IE00BVYPP024 | 18.1112 | 0.0631 | 08/05/2025 |
| GUINNESS GLOBAL EQUITY INCOME FUND CLASS Y GBP ACCUMULATION | IE00BVYPNY24 | 27.9411 | -0.005 | 08/05/2025 |
| GUINNESS GLOBAL EQUITY INCOME FUND CLASS Y GBP DISTRIBUTION | IE00BVYPP131 | 21.6954 | -0.0039 | 08/05/2025 |
| GUINNESS GLOBAL EQUITY INCOME FUND CLASS Y USD ACCUMULATION | IE00BVYPNX17 | 24.8867 | -0.1111 | 08/05/2025 |
| GUINNESS GLOBAL EQUITY INCOME FUND CLASS Y USD DISTRIBUTION | IE00BVYPP248 | 19.2719 | -0.086 | 08/05/2025 |
| GUINNESS GLOBAL EQUITY INCOME FUND CLASS C EUR DISTRIBUTION | IE00BDGV0183 | 16.9908 | 0.0589 | 08/05/2025 |
| GUINNESS GLOBAL EQUITY INCOME FUND CLASS D EUR ACCUMULATION | IE00BDGV0290 | 21.5654 | 0.0749 | 08/05/2025 |
| GUINNESS GLOBAL EQUITY INCOME FUND CLASS I USD DISTRIBUTION | IE00BGK8P991 | 17.1499 | -0.0766 | 08/05/2025 |
| GUINNESS GLOBAL EQUITY INCOME FUND CLASS I USD ACCUMULATION | IE00BJBK7883 | 16.7585 | -0.0749 | 08/05/2025 |
| GUINNESS GLOBAL EQUITY INCOME FUND CLASS C CNH HEDGED DISTR | IE000OP91FK6 | 11.7925 | -0.0559 | 08/05/2025 |
| GUINNESS GLOBAL EQUITY INCOME FUND CLASS Z GBP ACCUMULATION | IE000P7D8CD0 | 10.6806 | -0.0018 | 08/05/2025 |
| GUINNESS GLOBAL EQUITY INCOME FUND CLASS Z EUR DISTRIBUTION | IE00051OJYP3 | 10.7276 | 0.0375 | 08/05/2025 |
| GUINNESS GLOBAL EQUITY INCOME FUND CLASS Z EUR ACCUMULATION | IE000RSQ6GD6 | 10.8826 | 0.038 | 08/05/2025 |
| GUINNESS GLOBAL EQUITY INCOME FUND CLASS Z USD DISTRIBUTION | IE000YRPM569 | 11.3311 | -0.0506 | 08/05/2025 |
| GUINNESS GLOBAL EQUITY INCOME FUND CLASS Z USD ACCUMULATION | IE0001B1ARB7 | 11.4978 | -0.0513 | 08/05/2025 |
| GUINNESS GLOBAL EQUITY INCOME FUND CLASS Z USD NON-RPT ACC | IE0008RSJOC5 | 9.9556 | #N/A | 08/05/2025 |
| GUINNESS GLOBAL MONEY MANAGERS FUND CLASS C USD ACCUMULATION | IE00B3QW5Z07 | 26.6882 | 0.3547 | 08/05/2025 |
| GUINNESS GLOBAL MONEY MANAGERS FUND CLASS C GBP ACCUMULATION | IE00B64PRP62 | 31.5033 | 0.5513 | 08/05/2025 |
| GUINNESS GLOBAL MONEY MANAGERS FUND CLASS Y EUR ACCUMULATION | IE00B68GW162 | 35.3256 | 0.7467 | 08/05/2025 |
| GUINNESS GLOBAL MONEY MANAGERS FUND CLASS Y USD ACCUMULATION | IE00B3NSFR34 | 30.4505 | 0.4058 | 08/05/2025 |
| GUINNESS GLOBAL MONEY MANAGERS FUND CLASS Y GBP ACCUMULATION | IE00B7MJHM43 | 38.8841 | 0.6817 | 08/05/2025 |
| GUINNESS GLOBAL MONEY MANAGERS FUND CLASS C EUR ACCUMULATION | IE00BGHQF748 | 20.8437 | 0.4398 | 08/05/2025 |
| GUINNESS GLOBAL MONEY MANAGERS FUND CLASS I USD ACCUMULATION | IE00BMYPMW02 | 15.2322 | 0.203 | 08/05/2025 |
| GUINNESS EUROPEAN EQUITY INCOME FUND CLASS C EUR ACCUMULATION | IE00BGHQDW50 | 22.1434 | 0.0343 | 08/05/2025 |
| GUINNESS EUROPEAN EQUITY INCOME FUND CLASS F GBP DISTRIBUTION | IE00BGHQF300 | 19.0658 | -0.0397 | 08/05/2025 |
| GUINNESS EUROPEAN EQUITY INCOME FUND CLASS C GBP ACCUMULATION | IE00BVYPNS63 | 21.6855 | -0.0462 | 08/05/2025 |
| GUINNESS EUROPEAN EQUITY INCOME FUND CLASS C USD ACCUMULATION | IE00BVYPNT70 | 19.3474 | -0.1242 | 08/05/2025 |
| GUINNESS EUROPEAN EQUITY INCOME FUND CLASS Y GBP ACCUMULATION | IE00BYVHVZ98 | 16.7281 | -0.0351 | 08/05/2025 |
| GUINNESS EUROPEAN EQUITY INCOME FUND CLASS Y GBP DISTRIBUTION | IE00BYVHWJ06 | 13.4805 | -0.0283 | 08/05/2025 |
| GUINNESS EUROPEAN EQUITY INCOME FUND CLASS Y EUR ACCUMULATION | IE00BYVHW019 | 17.5554 | 0.0277 | 08/05/2025 |
| GUINNESS EUROPEAN EQUITY INCOME FUND CLASS Y EUR DISTRIBUTION | IE00BYVHW126 | 14.1447 | 0.0223 | 08/05/2025 |
| GUINNESS EUROPEAN EQUITY INCOME FUND CLASS Y USD ACCUMULATION | IE00BYVHW233 | 16.1463 | -0.1032 | 08/05/2025 |
| GUINNESS EUROPEAN EQUITY INCOME FUND CLASS Y USD DISTRIBUTION | IE00BYVHW340 | 12.9677 | -0.0828 | 08/05/2025 |
| GUINNESS EUROPEAN EQUITY INCOME FUND CLASS I USD ACCUMULATION | IE00BMYPN382 | 15.2857 | -0.0976 | 08/05/2025 |
| GUINNESS EUROPEAN EQUITY INCOME FUND CLASS I USD DISTRIBUTION | IE00BMYPN499 | 13.437 | -0.0858 | 08/05/2025 |
| GUINNESS EUROPEAN EQUITY INCOME FUND CLASS C EUR DISTRIBUTION | IE000AHX6WT2 | 11.1805 | 0.0173 | 08/05/2025 |
| GUINNESS EUROPEAN EQUITY INCOME FUND CLASS C GBP DISTRIBUTION | IE000N9K9CQ4 | 11.1458 | -0.0236 | 08/05/2025 |
| GUINNESS EUROPEAN EQUITY INCOME FUND CLASS C USD DISTRIBUTION | IE000RAMYLN7 | 10.6269 | -0.0681 | 08/05/2025 |
| GUINNESS EUROPEAN EQUITY INCOME FUND CLASS F GBP ACCUMULATION | IE000YNWUZY0 | 11.117 | -0.0231 | 08/05/2025 |
| GUINNESS EUROPEAN EQUITY INCOME FUND CLASS F EUR ACCUMULATION | IE000A0PQ631 | 11.3408 | 0.0181 | 08/05/2025 |
| GUINNESS EUROPEAN EQUITY INCOME FUND CLASS F EUR DISTRIBUTION | IE000IUDXQX3 | 11.0276 | 0.0175 | 08/05/2025 |
| GUINNESS ASIAN EQUITY INCOME FUND CLASS C EUR ACCUMULATION | IE00BGHQDM52 | 22.6691 | 0.188 | 08/05/2025 |
| GUINNESS ASIAN EQUITY INCOME FUND CLASS Z GBP DISTRIBUTION | IE00BGHQDV44 | 16.9953 | 0.0795 | 08/05/2025 |
| GUINNESS ASIAN EQUITY INCOME FUND CLASS C GBP ACCUMULATION | IE00BVYPNP33 | 18.8775 | 0.0876 | 08/05/2025 |
| GUINNESS ASIAN EQUITY INCOME FUND CLASS C USD ACCUMULATION | IE00BVYPNQ40 | 16.8101 | 0.0064 | 08/05/2025 |
| GUINNESS ASIAN EQUITY INCOME FUND CLASS Y EUR ACCUMULATION | IE00BDHSRG22 | 15.2142 | 0.1267 | 08/05/2025 |
| GUINNESS ASIAN EQUITY INCOME FUND CLASS Y EUR DISTRIBUTION | IE00BDHSRH39 | 11.1612 | 0.0929 | 08/05/2025 |
| GUINNESS ASIAN EQUITY INCOME FUND CLASS Y GBP ACCUMULATION | IE00BDHSRD90 | 15.2601 | 0.0713 | 08/05/2025 |
| GUINNESS ASIAN EQUITY INCOME FUND CLASS Y GBP DISTRIBUTION | IE00BDHSRF15 | 11.2149 | 0.0524 | 08/05/2025 |
| GUINNESS ASIAN EQUITY INCOME FUND CLASS Y USD ACCUMULATION | IE00BDHSRJ52 | 15.7042 | 0.0064 | 08/05/2025 |
| GUINNESS ASIAN EQUITY INCOME FUND CLASS Y USD DISTRIBUTION | IE00BDHSRK67 | 11.5134 | 0.0047 | 08/05/2025 |
| GUINNESS ASIAN EQUITY INCOME FUND CLASS I USD ACCUMULATION | IE00BMYPN051 | 12.487 | 0.0052 | 08/05/2025 |
| GUINNESS ASIAN EQUITY INCOME FUND CLASS I USD DISTRIBUTION | IE00BMYPN168 | 10.5484 | 0.0044 | 08/05/2025 |
| GUINNESS ASIAN EQUITY INCOME FUND CLASS Z GBP ACCUMULATION | IE000658NZ19 | 11.2314 | 0.0525 | 08/05/2025 |
| GUINNESS ASIAN EQUITY INCOME FUND CLASS Z EUR DISTRIBUTION | IE000KN6J1X6 | 11.0861 | 0.0929 | 08/05/2025 |
| GUINNESS ASIAN EQUITY INCOME FUND CLASS Z EUR ACCUMULATION | IE000UNWB7K2 | 11.4412 | 0.0953 | 08/05/2025 |
| GUINNESS ASIAN EQUITY INCOME FUND CLASS Z USD DISTRIBUTION | IE0007D42DP3 | 11.6929 | 0.0049 | 08/05/2025 |
| GUINNESS ASIAN EQUITY INCOME FUND CLASS Z USD ACCUMULATION | IE000D23O9K2 | 12.1056 | 0.005 | 08/05/2025 |
| GUINNESS GLOBAL INNOVATORS FUND CLASS C GBP ACCUMULATION | IE00BQXX3C00 | 32.7011 | 0.238 | 08/05/2025 |
| GUINNESS GLOBAL INNOVATORS FUND CLASS C EUR ACCUMULATION | IE00BQXX3D17 | 30.2234 | 0.33 | 08/05/2025 |
| GUINNESS GLOBAL INNOVATORS FUND CLASS C USD ACCUMULATION | IE00BQXX3F31 | 27.2053 | 0.0823 | 08/05/2025 |
| GUINNESS GLOBAL INNOVATORS FUND CLASS Y GBP ACCUMULATION | IE00BQXX3K83 | 36.4373 | 0.2662 | 08/05/2025 |
| GUINNESS GLOBAL INNOVATORS FUND CLASS Y EUR ACCUMULATION | IE00BQXX3L90 | 33.6401 | 0.3683 | 08/05/2025 |
| GUINNESS GLOBAL INNOVATORS FUND CLASS Y USD ACCUMULATION | IE00BQXX3M08 | 30.3955 | 0.0928 | 08/05/2025 |
| GUINNESS GLOBAL INNOVATORS FUND CLASS Z GBP ACCUMULATION | IE00BQXX3N15 | 37.2431 | 0.2722 | 08/05/2025 |
| GUINNESS GLOBAL INNOVATORS FUND CLASS Z EUR ACCUMULATION | IE00BQXX3P39 | 34.4069 | 0.3768 | 08/05/2025 |
| GUINNESS GLOBAL INNOVATORS FUND CLASS Z USD ACCUMULATION | IE00BQXX3Q46 | 30.9831 | 0.0947 | 08/05/2025 |
| GUINNESS GLOBAL INNOVATORS FUND CLASS I USD ACCUMULATION | IE00BMYPNG19 | 14.6059 | 0.0446 | 08/05/2025 |
| GUINNESS GLOBAL INNOVATORS FUND CLASS C CNH HEDGED DISTR | IE000PGA9O74 | 14.9029 | 0.0402 | 08/05/2025 |
| GUINNESS GREATER CHINA FUND CLASS C EUR ACCUMULATION | IE00BZ08YS42 | 12.2469 | 0.1883 | 08/05/2025 |
| GUINNESS GREATER CHINA FUND CLASS C GBP ACCUMULATION | IE00BZ08YR35 | 14.3099 | 0.1682 | 08/05/2025 |
| GUINNESS GREATER CHINA FUND CLASS C USD ACCUMULATION | IE00BZ08YT58 | 12.6649 | 0.0953 | 08/05/2025 |
| GUINNESS GREATER CHINA FUND CLASS Y EUR ACCUMULATION | IE00BZ08YW87 | 13.3597 | 0.2059 | 08/05/2025 |
| GUINNESS GREATER CHINA FUND CLASS Y GBP ACCUMULATION | IE00BZ08YV70 | 15.5935 | 0.1837 | 08/05/2025 |
| GUINNESS GREATER CHINA FUND CLASS Y USD ACCUMULATION | IE00BZ08YX94 | 13.7675 | 0.1039 | 08/05/2025 |
| GUINNESS GREATER CHINA FUND CLASS F GBP ACCUMULATION | IE00BZ08YY02 | 16.2911 | 0.1922 | 08/05/2025 |
| GUINNESS GREATER CHINA FUND CLASS I USD ACCUMULATION | IE00BMYPNC70 | 8.2741 | 0.0625 | 08/05/2025 |
| GUINNESS GREATER CHINA FUND CLASS F EUR ACCUMULATION | IE000PL4LIL5 | 11.433 | 0.177 | 08/05/2025 |
| GUINNESS GREATER CHINA FUND CLASS F USD ACCUMULATION | IE000KYOJNN5 | 12.107 | 0.092 | 08/05/2025 |
| GUINNESS EMERGING MARKETS EQUITY INCOME FUND CLASS C USD ACCUMULATION | IE00BYV24P56 | 16.5623 | 0.0654 | 08/05/2025 |
| GUINNESS EMERGING MARKETS EQUITY INCOME FUND CLASS Y GBP ACCUMULATION | IE00BYV24Q63 | 16.588 | 0.1365 | 08/05/2025 |
| GUINNESS EMERGING MARKETS EQUITY INCOME FUND CLASS Y GBP DISTRIBUTION | IE00BYV24R70 | 12.5172 | 0.103 | 08/05/2025 |
| GUINNESS EMERGING MARKETS EQUITY INCOME FUND CLASS Y EUR ACCUMULATION | IE00BYV24S87 | 16.693 | 0.1981 | 08/05/2025 |
| GUINNESS EMERGING MARKETS EQUITY INCOME FUND CLASS Y EUR DISTRIBUTION | IE00BYV24T94 | 12.5816 | 0.1493 | 08/05/2025 |
| GUINNESS EMERGING MARKETS EQUITY INCOME FUND CLASS Y USD ACCUMULATION | IE00BYV24V17 | 18.0142 | 0.0718 | 08/05/2025 |
| GUINNESS EMERGING MARKETS EQUITY INCOME FUND CLASS Y USD DISTRIBUTION | IE00BYV24W24 | 13.5688 | 0.0541 | 08/05/2025 |
| GUINNESS EMERGING MARKETS EQUITY INCOME FUND CLASS F GBP DISTRIBUTION | IE00BYV24X31 | 13.0562 | 0.1076 | 08/05/2025 |
| GUINNESS EMERGING MARKETS EQUITY INCOME FUND CLASS C EUR ACCUMULATION | IE00BMCWC346 | 12.8092 | 0.1516 | 08/05/2025 |
| GUINNESS EMERGING MARKETS EQUITY INCOME FUND CLASS C GBP ACCUMULATION | IE00BMCWC239 | 11.9648 | 0.0981 | 08/05/2025 |
| GUINNESS EMERGING MARKETS EQUITY INCOME FUND CLASS I USD ACCUMULATION | IE00BMYPND87 | 12.4677 | 0.0497 | 08/05/2025 |
| GUINNESS EMERGING MARKETS EQUITY INCOME FUND CLASS I USD DISTRIBUTION | IE00BMYPNF02 | 10.6337 | 0.0424 | 08/05/2025 |
| GUINNESS EMERGING MARKETS EQUITY INCOME FUND CLASS C EUR DISTRIBUTION | IE0009746VI0 | 10.1422 | 0.1201 | 08/05/2025 |
| GUINNESS EMERGING MARKETS EQUITY INCOME FUND CLASS C GBP DISTRIBUTION | IE000UPHOYQ6 | 10.1096 | 0.0829 | 08/05/2025 |
| GUINNESS EMERGING MARKETS EQUITY INCOME FUND CLASS C USD DISTRIBUTION | IE000XFJTUO9 | 9.6483 | 0.0381 | 08/05/2025 |
| GUINNESS EMERGING MARKETS EQUITY INCOME FUND CLASS F GBP ACCUMULATION | IE000S23Y5E4 | 11.043 | 0.091 | 08/05/2025 |
| GUINNESS EMERGING MARKETS EQUITY INCOME FUND CLASS F EUR ACCUMULATION | IE000PRGIAG7 | 11.274 | 0.133 | 08/05/2025 |
| GUINNESS EMERGING MARKETS EQUITY INCOME FUND CLASS F EUR DISTRIBUTION | IE000EYWH6W0 | 10.9196 | 0.1308 | 08/05/2025 |
| GUINNESS EMERGING MARKETS EQUITY INCOME FUND CLASS F USD ACCUMULATION | IE000STEY2E9 | 11.927 | 0.048 | 08/05/2025 |
| GUINNESS EMERGING MARKETS EQUITY INCOME FUND CLASS F USD DISTRIBUTION | IE0002MGLE49 | 11.5353 | 0.0464 | 08/05/2025 |
| GUINNESS BEST OF ASIA FUND CLASS C GBP ACCUMULATION | IE00BF2VFX37 | 11.0417 | 0.1273 | 08/05/2025 |
| GUINNESS BEST OF ASIA FUND CLASS Y GBP ACCUMULATION | IE00BF2VFY44 | 11.9234 | 0.1379 | 08/05/2025 |
| GUINNESS BEST OF ASIA FUND CLASS Y EUR ACCUMULATION | IE00BF2VFZ50 | 12.4921 | 0.1898 | 08/05/2025 |
| GUINNESS BEST OF ASIA FUND CLASS Y USD ACCUMULATION | IE00BF2VG076 | 11.8109 | 0.0866 | 08/05/2025 |
| GUINNESS BEST OF ASIA FUND CLASS F GBP ACCUMULATION | IE00BF2VG183 | 12.2442 | 0.1418 | 08/05/2025 |
| GUINNESS BEST OF ASIA FUND CLASS I USD ACCUMULATION | IE00BMYPN275 | 10.2572 | 0.0751 | 08/05/2025 |
| GUINNESS BEST OF ASIA FUND CLASS C EUR ACCUMULATION | IE000IYIWG07 | 9.2993 | 0.141 | 08/05/2025 |
| GUINNESS BEST OF ASIA FUND CLASS C USD ACCUMULATION | IE0004NN3YY8 | 8.8685 | 0.0648 | 08/05/2025 |
| GUINNESS BEST OF ASIA FUND CLASS F EUR ACCUMULATION | IE000IPJNIR0 | 11.326 | 0.172 | 08/05/2025 |
| GUINNESS BEST OF ASIA FUND CLASS F USD ACCUMULATION | IE0006E14U67 | 11.995 | 0.088 | 08/05/2025 |
| GUINNESS MULTI-ASSET GROWTH FUND CLASS C GBP ACCUMULATION | IE00BG5QQP10 | 14.2495 | 0.1413 | 08/05/2025 |
| GUINNESS MULTI-ASSET GROWTH FUND CLASS C EUR ACCUMULATION | IE00BG5QQQ27 | 15.158 | 0.2056 | 08/05/2025 |
| GUINNESS MULTI-ASSET GROWTH FUND CLASS C EUR HEDGED ACC | IE00BG5QQR34 | 11.9696 | 0.1181 | 08/05/2025 |
| GUINNESS MULTI-ASSET GROWTH FUND CLASS C USD ACCUMULATION | IE00BG5QQS41 | 14.9517 | 0.0849 | 08/05/2025 |
| GUINNESS MULTI-ASSET GROWTH FUND CLASS C USD HEDGED ACC | IE00BG5QRJ25 | 13.1598 | 0.1292 | 08/05/2025 |
| GUINNESS MULTI-ASSET GROWTH FUND CLASS O GBP ACCUMULATION | IE00BG5QRK30 | 15.0948 | 0.1501 | 08/05/2025 |
| GUINNESS MULTI-ASSET GROWTH FUND CLASS O EUR ACCUMULATION | IE00BG5QRL47 | 16.0639 | 0.2183 | 08/05/2025 |
| GUINNESS MULTI-ASSET GROWTH FUND CLASS O EUR HEDGED ACC | IE00BG5QRM53 | 12.6439 | 0.125 | 08/05/2025 |
| GUINNESS MULTI-ASSET GROWTH FUND CLASS O USD ACCUMULATION | IE00BG5QRN60 | 15.8392 | 0.0903 | 08/05/2025 |
| GUINNESS MULTI-ASSET GROWTH FUND CLASS O USD HEDGED ACC | IE00BG5QRP84 | 13.8456 | 0.1363 | 08/05/2025 |
| GUINNESS MULTI-ASSET GROWTH FUND CLASS R GBP ACCUMULATION | IE00BG5QRQ91 | 14.0706 | 0.1394 | 08/05/2025 |
| GUINNESS MULTI-ASSET GROWTH FUND CLASS R EUR ACCUMULATION | IE00BG5QRR09 | 14.98 | 0.2031 | 08/05/2025 |
| GUINNESS MULTI-ASSET GROWTH FUND CLASS R EUR HEDGED ACC | IE00BG5QRS16 | 11.8221 | 0.1165 | 08/05/2025 |
| GUINNESS MULTI-ASSET GROWTH FUND CLASS R USD ACCUMULATION | IE00BG5QRT23 | 14.7524 | 0.0837 | 08/05/2025 |
| GUINNESS MULTI-ASSET GROWTH FUND CLASS R USD HEDGED ACC | IE00BG5QRV45 | 13.0126 | 0.1277 | 08/05/2025 |
| GUINNESS MULTI-ASSET GROWTH FUND CLASS Y GBP ACCUMULATION | IE00BG5QRW51 | 15.3671 | 0.1529 | 08/05/2025 |
| GUINNESS MULTI-ASSET BALANCED FUND CLASS C GBP ACCUMULATION | IE00BG5QQV79 | 13.3442 | 0.1125 | 08/05/2025 |
| GUINNESS MULTI-ASSET BALANCED FUND CLASS C EUR ACCUMULATION | IE00BG5QQW86 | 14.1956 | 0.1716 | 08/05/2025 |
| GUINNESS MULTI-ASSET BALANCED FUND CLASS C EUR HEDGED ACC | IE00BG5QQX93 | 11.3132 | 0.0946 | 08/05/2025 |
| GUINNESS MULTI-ASSET BALANCED FUND CLASS C USD ACCUMULATION | IE00BG5QQY01 | 14.0016 | 0.0586 | 08/05/2025 |
| GUINNESS MULTI-ASSET BALANCED FUND CLASS C USD HEDGED ACC | IE00BG5QQZ18 | 12.3954 | 0.1035 | 08/05/2025 |
| GUINNESS MULTI-ASSET BALANCED FUND CLASS O GBP ACCUMULATION | IE00BG5QR034 | 14.1362 | 0.1195 | 08/05/2025 |
| GUINNESS MULTI-ASSET BALANCED FUND CLASS O EUR ACCUMULATION | IE00BG5QR141 | 15.0421 | 0.1822 | 08/05/2025 |
| GUINNESS MULTI-ASSET BALANCED FUND CLASS O EUR HEDGED ACC | IE00BG5QR257 | 11.9625 | 0.1004 | 08/05/2025 |
| GUINNESS MULTI-ASSET BALANCED FUND CLASS O USD ACCUMULATION | IE00BG5QR364 | 14.8317 | 0.0624 | 08/05/2025 |
| GUINNESS MULTI-ASSET BALANCED FUND CLASS O USD HEDGED ACC | IE00BG5QR471 | 13.1057 | 0.1099 | 08/05/2025 |
| GUINNESS MULTI-ASSET BALANCED FUND CLASS R GBP ACCUMULATION | IE00BG5QR588 | 13.1739 | 0.1111 | 08/05/2025 |
| GUINNESS MULTI-ASSET BALANCED FUND CLASS R EUR ACCUMULATION | IE00BG5QR695 | 14.0195 | 0.1694 | 08/05/2025 |
| GUINNESS MULTI-ASSET BALANCED FUND CLASS R EUR HEDGED ACC | IE00BG5QR703 | 11.1873 | 0.0935 | 08/05/2025 |
| GUINNESS MULTI-ASSET BALANCED FUND CLASS R USD ACCUMULATION | IE00BG5QR810 | 13.8129 | 0.0577 | 08/05/2025 |
| GUINNESS MULTI-ASSET BALANCED FUND CLASS R USD HEDGED ACC | IE00BG5QR927 | 12.3087 | 0.1027 | 08/05/2025 |
| GUINNESS MULTI-ASSET BALANCED FUND CLASS Y GBP ACCUMULATION | IE00BG5QRB49 | 14.3859 | 0.1218 | 08/05/2025 |
| GUINNESS GLOBAL QUALITY MID CAP FUND CLASS F USD ACCUMULATION | IE00BN0W3529 | 10.9349 | 0.1673 | 08/05/2025 |
| GUINNESS GLOBAL QUALITY MID CAP FUND CLASS F GBP ACCUMULATION | IE00BN0W3305 | 11.0157 | 0.2148 | 08/05/2025 |
| GUINNESS GLOBAL QUALITY MID CAP FUND CLASS F EUR ACCUMULATION | IE00BN0W3412 | 11.8005 | 0.2726 | 08/05/2025 |
| GUINNESS GLOBAL QUALITY MID CAP FUND CLASS I GBP ACCUMULATION | IE00BN0W2X30 | 10.8084 | 0.2107 | 08/05/2025 |
| GUINNESS GLOBAL QUALITY MID CAP FUND CLASS I EUR ACCUMULATION | IE00BN0W2Y47 | 11.5672 | 0.2671 | 08/05/2025 |
| GUINNESS GLOBAL QUALITY MID CAP FUND CLASS I USD ACCUMULATION | IE00BN0W2Z53 | 10.7296 | 0.1639 | 08/05/2025 |
| GUINNESS GLOBAL QUALITY MID CAP FUND CLASS Y GBP ACCUMULATION | IE00BN0W3073 | 10.8074 | 0.2106 | 08/05/2025 |
| GUINNESS GLOBAL QUALITY MID CAP FUND CLASS Y EUR ACCUMULATION | IE00BN0W3180 | 11.568 | 0.267 | 08/05/2025 |
| GUINNESS GLOBAL QUALITY MID CAP FUND CLASS Y USD ACCUMULATION | IE00BN0W3297 | 10.733 | 0.1641 | 08/05/2025 |
| GUINNESS GLOBAL QUALITY MID CAP FUND CLASS C GBP ACCUMULATION | IE00BN0W2T93 | 10.3002 | 0.2004 | 08/05/2025 |
| GUINNESS GLOBAL QUALITY MID CAP FUND CLASS C EUR ACCUMULATION | IE00BN0W2V16 | 11.025 | 0.2541 | 08/05/2025 |
| GUINNESS GLOBAL QUALITY MID CAP FUND CLASS C USD ACCUMULATION | IE00BN0W2W23 | 10.2316 | 0.1561 | 08/05/2025 |
| GUINNESS PAN-EUROPEAN EQUITY INCOME FUND CLASS C EUR ACC | IE000QE5CYY9 | 9.8063 | 0.0129 | 08/05/2025 |
| GUINNESS PAN-EUROPEAN EQUITY INCOME FUND CLASS C EUR DIST | IE0004BNHDF9 | 9.8056 | 0.0124 | 08/05/2025 |
| GUINNESS PAN-EUROPEAN EQUITY INCOME FUND CLASS C GBP ACC | IE000MDEL2K5 | 10.0371 | -0.0242 | 08/05/2025 |
| GUINNESS PAN-EUROPEAN EQUITY INCOME FUND CLASS C GBP DIST | IE000ZUMIYN4 | 10.0371 | -0.0242 | 08/05/2025 |
| GUINNESS PAN-EUROPEAN EQUITY INCOME FUND CLASS C USD ACC | IE0002QUHW33 | 10.6095 | -0.0711 | 08/05/2025 |
| GUINNESS PAN-EUROPEAN EQUITY INCOME FUND CLASS C USD DIST | IE000616PPY9 | 10.6095 | -0.0711 | 08/05/2025 |
| GUINNESS PAN-EUROPEAN EQUITY INCOME FUND CLASS F EUR ACC | IE000U1HO3Y6 | 9.8412 | 0.013 | 08/05/2025 |
| GUINNESS PAN-EUROPEAN EQUITY INCOME FUND CLASS F EUR DIST | IE00011MGKP6 | 9.8412 | 0.013 | 08/05/2025 |
| GUINNESS PAN-EUROPEAN EQUITY INCOME FUND CLASS F GBP ACC | IE0006HJR2U0 | 10.0729 | -0.0239 | 08/05/2025 |
| GUINNESS PAN-EUROPEAN EQUITY INCOME FUND CLASS F GBP DIST | IE000OF3L0L0 | 10.0729 | -0.0239 | 08/05/2025 |
| GUINNESS PAN-EUROPEAN EQUITY INCOME FUND CLASS I USD ACC | IE000IL9H7B6 | 10.6354 | -0.071 | 08/05/2025 |
| GUINNESS PAN-EUROPEAN EQUITY INCOME FUND CLASS I USD DIST | IE000CCV9AJ8 | 10.6354 | -0.071 | 08/05/2025 |
| GUINNESS PAN-EUROPEAN EQUITY INCOME FUND CLASS Y EUR ACC | IE000GYHWEK5 | 9.8282 | 0.0126 | 08/05/2025 |
| GUINNESS PAN-EUROPEAN EQUITY INCOME FUND CLASS Y EUR DIST | IE000XCBZKS2 | 9.8282 | 0.0126 | 08/05/2025 |
| GUINNESS PAN-EUROPEAN EQUITY INCOME FUND CLASS Y GBP ACC | IE000C6KDI61 | 10.0608 | -0.0238 | 08/05/2025 |
| GUINNESS PAN-EUROPEAN EQUITY INCOME FUND CLASS Y GBP DIST | IE000CQOX716 | 10.0608 | -0.0238 | 08/05/2025 |
| GUINNESS PAN-EUROPEAN EQUITY INCOME FUND CLASS Y USD ACC | IE00028D2911 | 10.6348 | -0.0709 | 08/05/2025 |
| GUINNESS PAN-EUROPEAN EQUITY INCOME FUND CLASS Y USD DIST | IE000H8KD8J4 | 10.6354 | -0.071 | 08/05/2025 |
| GUINNESS SUSTAINABLE ENERGY FUND CLASS D USD ACCUMULATION | IE00B2PGVJ29 | 4.335 | 0.0442 | 08/05/2025 |
| GUINNESS SUSTAINABLE ENERGY FUND CLASS C USD ACCUMULATION | IE00B2PGVK34 | 3.9735 | 0.0405 | 08/05/2025 |
| GUINNESS SUSTAINABLE ENERGY FUND CLASS C GBP ACCUMULATION | IE00B3CCJ633 | 6.8923 | 0.0994 | 08/05/2025 |
| GUINNESS SUSTAINABLE ENERGY FUND CLASS D EUR ACCUMULATION | IE00B3CCJ740 | 7.1879 | 0.1298 | 08/05/2025 |
| GUINNESS SUSTAINABLE ENERGY FUND CLASS C EUR ACCUMULATION | IE00BGHQF417 | 14.2845 | 0.2575 | 08/05/2025 |
| GUINNESS SUSTAINABLE ENERGY FUND CLASS Y GBP ACCUMULATION | IE00BFYV9L73 | 18.224 | 0.2634 | 08/05/2025 |
| GUINNESS SUSTAINABLE ENERGY FUND CLASS Y EUR ACCUMULATION | IE00BFYV9M80 | 19.0597 | 0.3443 | 08/05/2025 |
| GUINNESS SUSTAINABLE ENERGY FUND CLASS Y USD ACCUMULATION | IE00BFYV9N97 | 17.2756 | 0.1768 | 08/05/2025 |
| GUINNESS SUSTAINABLE ENERGY FUND CLASS I USD ACCUMULATION | IE00BMYPNB63 | 9.135 | 0.0935 | 08/05/2025 |
| GUINNESS SUSTAINABLE ENERGY FUND CLASS C CNH HEDGED DISTR | IE000JUVS7B9 | 7.8094 | 0.0776 | 08/05/2025 |
| GUINNESS GLOBAL ENERGY FUND CLASS D USD ACCUMULATION | IE00B2Q91T05 | 8.6048 | 0.0893 | 08/05/2025 |
| GUINNESS GLOBAL ENERGY FUND CLASS C USD ACCUMULATION | IE00B2Q91V27 | 7.9933 | 0.0828 | 08/05/2025 |
| GUINNESS GLOBAL ENERGY FUND CLASS C GBP ACCUMULATION | IE00B3CCJ963 | 11.0558 | 0.1611 | 08/05/2025 |
| GUINNESS GLOBAL ENERGY FUND CLASS D EUR ACCUMULATION | IE00B3CCJB88 | 11.5285 | 0.2099 | 08/05/2025 |
| GUINNESS GLOBAL ENERGY FUND CLASS Y USD ACCUMULATION | IE00B3CCJC95 | 9.4146 | 0.0978 | 08/05/2025 |
| GUINNESS GLOBAL ENERGY FUND CLASS Y GBP ACCUMULATION | IE00B6XV0016 | 10.9991 | 0.1607 | 08/05/2025 |
| GUINNESS GLOBAL ENERGY FUND CLASS C EUR ACCUMULATION | IE00BGHQF524 | 8.9472 | 0.1628 | 08/05/2025 |
| GUINNESS GLOBAL ENERGY FUND CLASS Y USD DISTRIBUTION | IE00BG6L7638 | 6.5668 | 0.0682 | 08/05/2025 |
| GUINNESS GLOBAL ENERGY FUND CLASS Y EUR ACCUMULATION | IE00BFMGVR44 | 10.55 | 0.1922 | 08/05/2025 |
| GUINNESS GLOBAL ENERGY FUND CLASS I USD ACCUMULATION | IE00BMYPN507 | 18.5453 | 0.1926 | 08/05/2025 |
| GUINNESS GLOBAL ENERGY FUND CLASS C CNH HEDGED DISTR | IE000P8HSFB7 | 9.0293 | 0.0904 | 08/05/2025 |
| WS GUINNESS UK EQUITY INCOME FUND O OVERSEAS ACCUMULATION | GB00BYX94F49 | 97.22 | -0.23 | 09/05/2025 |
| WS GUINNESS UK EQUITY INCOME FUND O OVERSEAS INCOME | GB00BYX94G55 | 70.94 | -0.16 | 09/05/2025 |
| WS GUINNESS UK EQUITY INCOME FUND Y CLEAN ACCUMULATION | GB00BYX94H62 | 105.89 | -0.24 | 09/05/2025 |
| WS GUINNESS UK EQUITY INCOME FUND Y CLEAN INCOME | GB00BYX94J86 | 77.7 | -0.18 | 09/05/2025 |
| WS GUINNESS UK EQUITY INCOME FUND Z EARLY INVESTOR ACCUMULATION | GB00BYX94K91 | 107.61 | -0.25 | 09/05/2025 |
| WS GUINNESS UK EQUITY INCOME FUND Z EARLY INVESTOR INCOME | GB00BYX94L09 | 78.83 | -0.18 | 09/05/2025 |
| WS GUINNESS GLOBAL EQUITY INCOME FUND Y ACCUMULATION GBP | GB00BNGFN776 | 166.31 | -1.44 | 09/05/2025 |
| WS GUINNESS GLOBAL EQUITY INCOME FUND Y INCOME GBP | GB00BNGFN669 | 149.98 | -1.31 | 09/05/2025 |
| WS GUINNESS ASIAN EQUITY INCOME FUND Y ACCUMULATION GBP | GB00BMFKG667 | 116.63 | 0.59 | 09/05/2025 |
| WS GUINNESS ASIAN EQUITY INCOME FUND Y INCOME GBP | GB00BMFKG774 | 98.66 | 0.5 | 09/05/2025 |
| WS GUINNESS EUROPEAN EQUITY INCOME FUND Y ACCUMULATION GBP | GB00BP5J6M04 | 134.61 | -0.65 | 09/05/2025 |
| WS GUINNESS EUROPEAN EQUITY INCOME FUND Y INCOME GBP | GB00BP5J6N11 | 126.09 | -0.6 | 09/05/2025 |
| WS GUINNESS EUROPEAN EQUITY INCOME FUND F ACCUMULATION GBP | GB00BP5J6P35 | 136.34 | -0.65 | 09/05/2025 |
| WS GUINNESS EUROPEAN EQUITY INCOME FUND F INCOME GBP | GB00BP5J6Q42 | 127.91 | -0.61 | 09/05/2025 |
| WS GUINNESS GLOBAL INNOVATORS FUND Y ACCUMULATION GBP | GB00BP5J5Y50 | 153.08 | -0.81 | 09/05/2025 |
| WS GUINNESS SUSTAINABLE ENERGY FUND Y ACCUMULATION GBP | GB00BP5J6198 | 79.16 | 0.75 | 09/05/2025 |
| WS GUINNESS SUSTAINABLE ENERGY FUND Z ACCUMULATION GBP | GB00BP5J6206 | 79.49 | 0.76 | 09/05/2025 |
| WS GUINNESS GLOBAL QUALITY MID CAP FUND F ACCUMULATION GBP | GB00BP5J7D87 | 101.87 | 0.34 | 09/05/2025 |
| WS GUINNESS GLOBAL QUALITY MID CAP FUND Y ACCUMULATION GBP | GB00BP5J7C70 | 100.6 | 0.33 | 09/05/2025 |
| WS GUINNESS GLOBAL EQUITY INCOME FUND Z ACCUMULATION GBP | GB00BLGT0N04 | 103.69 | -0.9 | 09/05/2025 |
| WS GUINNESS GLOBAL EQUITY INCOME FUND Z INCOME GBP | GB00BLGT0P28 | 102.2 | -0.88 | 09/05/2025 |
| WS GUINNESS ASIAN EQUITY INCOME FUND Z ACCUMULATION GBP | GB00BLGT0Q35 | 107.41 | 0.53 | 09/05/2025 |
| WS GUINNESS ASIAN EQUITY INCOME FUND Z INCOME GBP | GB00BLGT0R42 | 105.38 | 0.53 | 09/05/2025 |
| WS GUINNESS GLOBAL INNOVATORS FUND Z ACCUMULATION GBP | GB00BLGT0S58 | 97.02 | -0.51 | 09/05/2025 |
| WS GUINNESS GLOBAL ENERGY FUND I ACCUMULATION | GB00B56FW078 | 43.74 | 0.75 | 09/05/2025 |
Guinness Global Energy - Webcast
Trustnet - Schroder’s Kirrage: Oil will not stray from its long-term natural price of $80 a barrel
Global Energy - 2025 Outlook
Guinness Global Energy - Webcast - Covering Q4 2024
Trustnet - Is this a good time to revisit out-of-favour oil stocks?
Guinness Global Energy - Webcast - Covering Q3 2024
Guinness Global Energy - Webcast - Covering Q2 2024
Guinness Global Energy Fund - Webcast - Covering Q1 2024
Energy - An outlook for 2024
WS Guinness Global Energy Fund is an equity fund. Investors should be willing and able to assume the risks of equity investing. The Fund invests only in companies involved in the energy sector; it is therefore susceptible to the performance of that one sector, and can be volatile. The value of an investment and the income from it can fall as well as rise as a result of market and currency movement; you may not get back the amount originally invested. For full information on the risks, please refer to the Prospectus and KIID for the Fund, which are available on our website (guinnessgi.com/literature). If you decide to invest, you will be buying units/shares in the Fund and will not be investing directly in the underlying assets of the Fund. Past performance does not predict future returns.
Source: FE fundinfo. Net of fees. Investors should note that fees and expenses are charged to the capital of the Fund. This reduces the return on your investment by an amount equivalent to the Ongoing Charges Figure (OCF). The current OCF for the share class used for the fund performance returns is [get_ocf_isin]. Returns for share classes with a different OCF will vary accordingly. Transaction costs also apply and are incurred when a fund buys or sells holdings. The performance returns do not reflect any initial charge; any such charge will also reduce the return. Graph data is in USD from 31.03.08.