Price/Earnings-to-Growth (PEG) Ratio: Formula & Misconceptions

What is PEG Ratio?
The price/earnings-to-growth (PEG) ratio is a core valuation metric that builds on the P/E ratio by adjusting for a company’s expected earnings growth. It is calculated by dividing a firm’s P/E ratio by its earnings growth rate (EGR), the rate at which a company’s earnings per share are expected to grow over a given period. By incorporating growth into valuation, the PEG ratio aims to provide a more balanced view of whether a company’s share price is justified relative to its growth prospects.
Forward vs Trailing PEG Ratios
PEG Ratios can take two distinct forms: Trailing PEG, which is calculated with historical EGR, and Forward PEG, which is calculated with predicted EGR.
Trailing PEG
Trailing PEG ratios typically use historical EGR over one-, three-, or five-year periods. Because historical data is more objective and uniform across sources, trailing PEG tends to provide a more conservative view, avoiding the speculative optimism that can be found in analyst predictions.
However, while Trailing PEG avoids incorporating any analyst hype, it doesn't capture a company's future growth prospects, especially if the company or industry has recently undergone deep structural or technological changes. In addition, one-off events (such as litigation, restructuring or natural disasters) can distort backwards-looking data and further muddy the picture.
Forward PEG
Forward PEG is based on analysts' forecasts of the firm’s EGR over one-, three-, or five-year periods. As investment is, by its nature, a forward-looking activity, the Forward PEG is more favoured by investors and is the more commonly used form. Forward PEG captures changes, expansions, and industry tailwinds that Trailing PEG misses, making it useful when analysing growth companies in flux.
However, the accuracy and reliability of Forward PEG depend entirely on the estimates used, which can vary widely by source, as different analysts may make different assumptions or apply unique weightings to growth factors. It is important to keep this in mind and to consider that predictions with longer time horizons are inevitably less accurate.
PEG Ratio Calculation
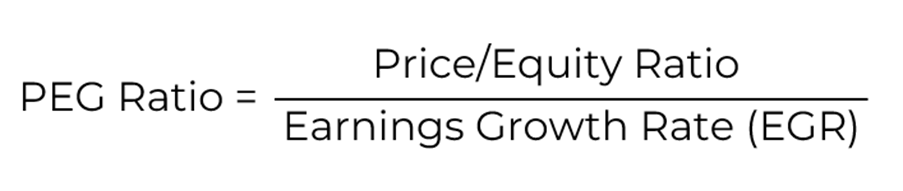
The PEG Ratio of a company is calculated by dividing its P/E Ratio by the one-, three-, or five-year EGR.
The forward P/E and EGR are used to calculate the forward PEG, while the trailing P/E and EGR are used to calculate the trailing PEG. A company’s trailing EGR can be found in annual reports or supplied by market data providers such as Bloomberg, while a company’s future EGR growth rates can be found in investor analyst reports on the company. It is also important to note that the EGR is expressed as a full number rather than a percentage (i.e. a 25% EPS growth rate would be 25 in the formula).
What is considered a good PEG ratio?
Generally, the lower the PEG ratio, the better. Although markets are constantly evolving, one yardstick is to view a PEG ratio of 1 as ‘fair value’, meaning that the share price is in line with the company’s expected growth. As EPS growth is completely ‘priced in’, the share price is neither under- nor overvalued from a growth standpoint.
A PEG ratio above 1 implies a firm is overvalued relative to its growth, while a PEG ratio below 1 implies it is undervalued relative to its growth.
Example
Firm A has a share price of £120 and an expected 1-year EPS of £6. As the firm is well established in a mature and stable industry, analysts have predicted that Firm A’s EGR over the next three years will be 12%.
Forward P/E ratio: 120/6 = 20
Forward PEG: 20/12 = 1.67
Firm B has a share price of £140 and an expected 1-year EPS of £5. Due to some technological upgrades Firm B plans to implement over the next few years, analysts have predicted Firm B’s EGR over the next three years will be 45%.
Forward P/E ratio: 140/5 = 28
Forward PEG: 28/45 = 0.62
While the forward P/E ratio for Firm B makes it look more expensive, trading at 28x its earnings compared to Firm A’s 20x, the picture changes when taking into account EGR. With Firm B predicted to grow nearly four times faster than Firm A, an investor would be paying less per unit of growth were they to buy shares in Firm B.
However, one should note that the EGR’s three-year time horizon could raise concerns about the accuracy of analyst predictions. Industries and technologies can shift quickly, and current estimates could become moot with new information.
Common misconceptions
There are some common misconceptions regarding the PEG ratio
A PEG Ratio Below 1 Always Means a Stock Is Undervalued
While a PEG ratio below one is often interpreted as a company being undervalued, this is not necessarily the case. A low PEG may reflect overly optimistic growth assumptions, particularly when based on forward EGR estimates. It may also signal excessive risk taking, or one-off growth drivers that are unlikely to persist.
Forward PEG Is Always Better Than Trailing PEG
Although investing is inherently forward-looking, forward PEG ratios rely heavily on analyst forecasts, which can be biased or inaccurate, especially over longer time horizons. In uncertain or rapidly changing environments, pairing a forward PEG with a trailing PEG can provide a more grounded analysis.
PEG Ratios Are Comparable Across All Industries
PEG ratios are most useful when comparing firms within the same industry. Different sectors have different growth rates, capital requirements, and risk profiles on a structural level. A “good” PEG in a mature utility sector may look very different from a “good” PEG in biotech.
How Guinness uses PEG
At Guinness Global Investors, we use the PEG ratio as a complementary valuation tool rather than a definitive measure. It is important to understand that while PEG can offer useful insight into how much investors are paying for growth, it can also be distorted by temporary events, sector dynamics, or overly optimistic growth expectations. Thus, we never rely on the PEG ratio in isolation, but embed it within a broader framework that also considers business quality, balance-sheet strength, industry context, and other valuation metrics. You can learn more about our investment strategy and philosophy here.
This Insight may provide information about Fund portfolios, including recent activity and performance and may contain facts relating to equity markets and our own interpretation. Any investment decision should take account of the subjectivity of the comments contained in the report. This Insight is provided for information only and all the information contained in it is believed to be reliable but may be inaccurate or incomplete; any opinions stated are honestly held at the time of writing but are not guaranteed. The contents of this Insight should not therefore be relied upon. It should not be taken as a recommendation to make an investment in the Funds or to buy or sell individual securities, nor does it constitute an offer for sale.