Earnings per Share (EPS): How to calculate and use it

What is earnings per share?
Earnings per share (EPS) is a core financial metric that shows how much profit, or earnings, a company has made for every common share in the company. It is used to assess the value of each outstanding share and the company’s profitability as a whole, with a higher EPS implying higher levels of profitability and vice versa.
How to calculate earnings per share
To calculate EPS, it is important to understand the difference between common (or ordinary) and the less widely held preferred (or preference) shares. Preferred shares provide consistent fixed dividends and have payment priority over common shares (meaning preferred share dividends are paid first), but have a static value and provide no voting rights. Common shares, which give the holder voting rights, have a variable value that shifts with changes in the performance and profitability of the company.
The usual calculation of EPS (usually done on an annual or quarterly basis) is the division of net profit by the number of outstanding shares. However, it is important to note that there are two distinct types of EPS: Basic EPS and Diluted EPS.
Basic Earnings per share formula
Basic EPS is calculated by subtracting preferred dividends from net income to find net profit, which is then divided by the number of common shares outstanding.
EPS only measures the value of common shares, as it is the common shareholder who bears the risk and reward of fluctuating profits, while preferred shares have a fixed value deriving from preferred dividends.

Outstanding shares are simply those held by shareholders outside of the company.
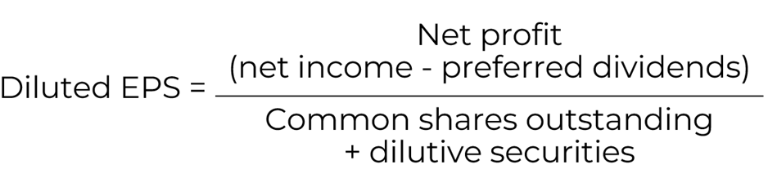
Diluted Earnings per share formula
Diluted EPS takes into consideration dilutive securities. Dilutive securities are financial instruments that can be converted into common shares (this includes instruments like convertible bonds, share options, and warrants). Conversions of dilutive securities into common shares increase (dilute) the number of outstanding shares and thus lower overall EPS for the investor.
A company’s diluted EPS provides a worst-case scenario, as it assumes that all potential shares get converted into actual shares, which could lower EPS substantially. Although this would be unusual, diluted EPS is an important metric, as without it, companies could present a misleading appearance of their profitability.
Publicly traded companies will usually list both their EPS and Diluted EPS on their income statement.
Example
Firm A has a relatively simple capital structure, with an annual net income of £900,000 and 500,000 common shares outstanding, and pays out £100,000 in preferred dividends annually.
Firm B has a higher annual net income of £1,100,000 and the same amount of common shares outstanding. However, it pays out £200,000 in preferred dividends annually and has also issued 100,000 share options as part of an employee compensation scheme.
Share options are a financial instrument that gives the holder an option to buy a company’s common shares at a set price within a certain time. It is considered a dilutive security as it can be converted into common shares.
| Firm A (~000s) | Firm B (~000s) | |
| Net income | £900 | £1,100 |
| Preferred dividends | £100 | £200 |
| Common Shares Outstanding | 500 | 500 |
| Stock Options | - | 100 |
Firm A basic EPS: (900 – 100) / 500= £1.6
Firm B basic EPS: (1,100– 200) / 500 = £1.8
Firm B’s shares have a higher EPS, which could mean they are more profitable than Firm A’s. However, when you consider Firm B’s diluted EPS, the picture is a bit different:
Firm B diluted EPS: (1,100 – 200) / (500+100) = £1.5
(as Firm A has no dilutive securities, its diluted EPS and basic EPS are the same)
Firm B’s diluted EPS shows that its dilutive risk could mean the firm is less profitable than Firm A in the most conservative estimate. However, the difference between diluted EPS and basic EPS is not extreme, meaning Firm B’s dilution risk is relatively minimal, as it is unlikely that all dilutive shares will convert to common shares. This is because market conditions, employee decisions, and company strategy all play a part in conversion.
What are high or low earnings per share?
There are no set definitions of a 'good' or 'bad' EPS. However, comparative analysis against industry peers is a good way to assess whether a company has a relatively high/low level of profitability. In general, the higher the EPS, the better.
Other ways EPS is used in analysis
Aside from being a snapshot of a company’s profitability and dilution risk, EPS figures are essential in assessing a company’s comparative health and future potential.
A common use for EPS is comparative analysis. As mentioned before, this can be done against industry peers to assess if a firm is profitable for its sector. It can also be done by comparing actual EPS with analyst-predicted EPS, which can help forecast a change in share value. If actual EPS is higher than predicted EPS, it is likely to lead to an increase in share price and vice versa.
Tracking EPS over time can also be used to assess the growth trajectory of a company; a rising EPS could indicate organic or M&A-based growth or improving market conditions for the company, while a falling EPS could signal internal operational issues or an increasingly difficult market environment.
EPS is also an essential metric used in other valuation metrics, being a key part of the formula for the Price to Earnings Ratio (which indicates if a firm is over- or under-valued relative to its profitability), the PEG Ratio and the Dividend Payout Ratio (which assesses the sustainability of a company’s dividend payout based on its earnings).
Additionally, changing the timeframe of a company's EPS allows investors to calculate trailing P/E (based on historical EPS, usually over 12 months) or forward P/E (based on analyst EPS predictions, usually over 12 months).
Limitations
A company can easily influence its EPS by share buybacks (the purchasing of a company’s own common shares) or share issuance (the creation of new common shares). This affects the number of common shares outstanding and thus artificially inflates or reduces EPS.
There are also issues with comparative analysis. EPS can be affected by differences in accounting practices. The different methods with which companies recognise revenue, report taxes or calculate the depreciation of assets can all affect the final profit of a company, thus giving companies the ability to influence their EPS. Understanding a company's accounting practices can help investors get a more accurate picture.
In addition, EPS is affected by non-recurring events such as lawsuits, the destruction of property from natural disasters, or the sale of assets or property. These can have either a positive or negative effect on profit, thus affecting EPS. Investors thus must also consider any non-recurring events (within the timeframe they are analysing) when assessing EPS.
Conclusion
At Guinness Global Investors, our investment team analyses both basic and diluted EPS for comparative and trend analysis of hundreds of potential investments. This is done as part of a much wider overall value analysis of the company. Click here to learn more about our investment philosophy.
Learn more about the P/E Ratios, an essential valuation metric which builds on earnings per share.
This Insight may provide information about Fund portfolios, including recent activity and performance and may contain facts relating to equity markets and our own interpretation. Any investment decision should take account of the subjectivity of the comments contained in the report. This Insight is provided for information only and all the information contained in it is believed to be reliable but may be inaccurate or incomplete; any opinions stated are honestly held at the time of writing but are not guaranteed. The contents of this Insight should not therefore be relied upon. It should not be taken as a recommendation to make an investment in the Funds or to buy or sell individual securities, nor does it constitute an offer for sale.