Iran conflict and its many implications for energy equities


Following inconclusive negotiations between the US and Iran, the Strait of Hormuz is set to become even more firmly closed to energy exports from the Gulf as the US declares a blockade on all ships. This means the continued obstruction of 20m b/day of oil and product exports from the Gulf, around half of which we see as being offset by measures such as pipeline re-routing or strategic/sanctioned inventory releases. The resulting disruption of 10m b/day is the largest that we are aware of historically and will require demand destruction in order for markets to balance. Depending on its duration, prices of $125-150/bl could be required. Using a $90/bl and $80/bl Brent assumption in 2026 and 2027, together with a long-term estimate of $80/bl, still leaves the energy sector with about 20% upside.
We aim to assess the following:
- The underlying oil and oil product supply impact from the war, after allowing for pipeline re-routing and inventory releases.
- The scale of demand destruction needed and the oil price required to force the oil market into balance.
- The impact on the valuation on energy equities.
How much energy supply has been disrupted?
Since the outbreak of war, there have been a number of announcements and actions that have been designed to alleviate the disruption of oil and oil product supply through the Strait of Hormuz. We assess the impact of each as follows:
1. A few ships have been getting through the Strait of Hormuz
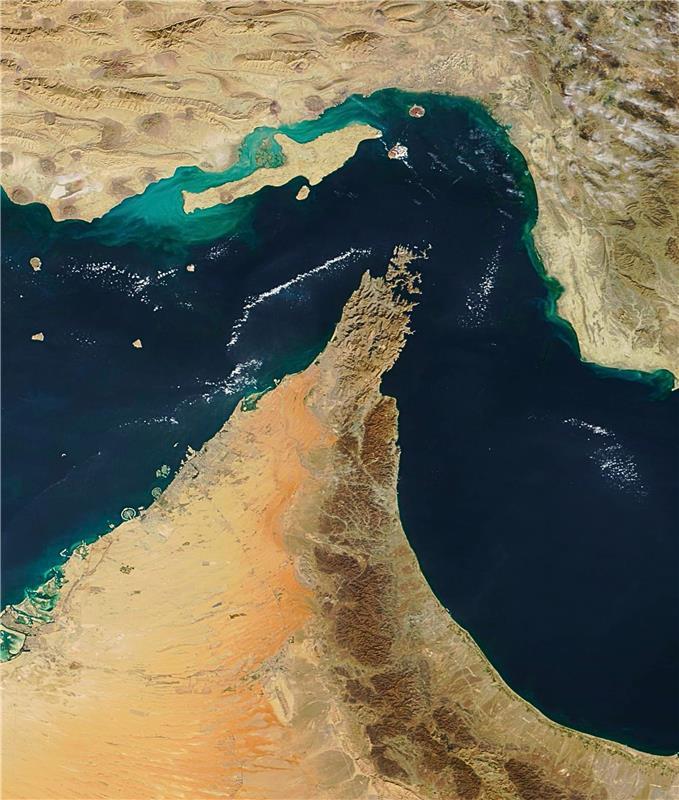
The Strait typically sees the passage of around 20m b/day of oil and oil product and around 10-11 Bcf/day of liquefied natural gas (LNG) with a total of around 35 tankers passing through in each direction every day. This remains the key constraint and, since the start of the war, an average of around 2 tankers (mostly Iranian) have been passing through the Strait. The rate increased in early April, but even this small tanker traffic is now threatened by the new US blockade, potentially taking a further 1-2m b/day of Iranian oil, which had been flowing to markets, out of the picture.
Number of daily transits through the Strait of Hormuz (12 April 2026)
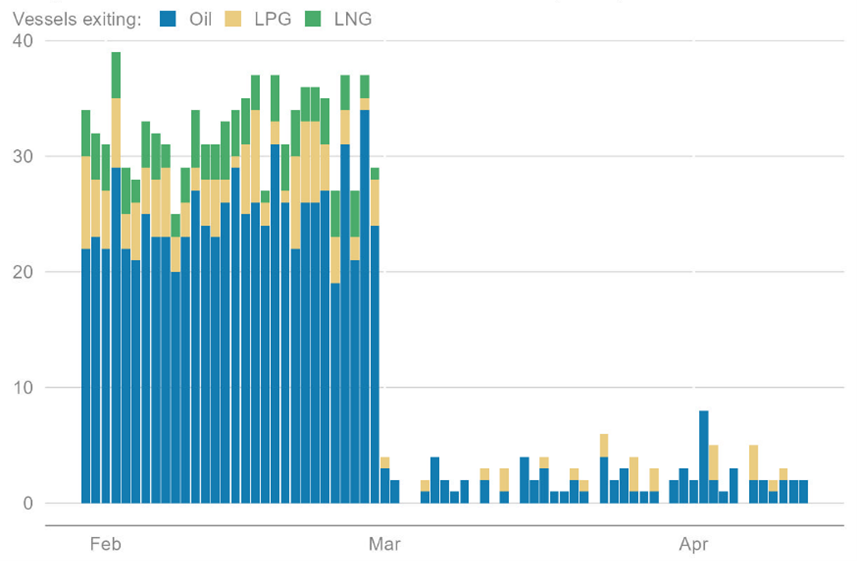
Source: Morgan Stanley; data as of 12.04.2026
2. Can oil be exported via pipelines to avoid the Strait of Hormuz?
There are three pipelines that offer spare capacity for oil exports from the Gulf, avoiding the Strait:
- The Saudi East-West pipeline and oil export terminal at Yanbu on the Red Sea offers extra export capacity of around 3-4m b/day. While the pipeline has a ‘surge’ capacity of 7m b/day, the export terminal only has capacity of around 5.5m b/day. Given that 1-2m b/day was already being exported along the pipe and 1m b/d from the terminal, we expect that a further 3-4m b/day could be re-directed away from the Strait of Hormuz. Data from Vortexa already indicates a sharp ramp-up in Saudi’s exports from Yanbu, closing in on 5m b/day at the end of March.
- The UAE Fujairah pipeline likely offers further export capacity. This pipeline, which avoids the Strait of Hormuz to the south, was already well utilised and there is likely around 0.5m b/day of extra export capacity. Exports in the second half of March were 2-2.5m b/day, up from the pre-war average of 1.5-2m b/day.
- The Iraq-Turkey pipeline north to Ceyhan also offers a smaller additional export capacity. A recent agreement between Iraq and Kurdistan has allowed a further 0.25m b/day of oil to be exported north from Iraq to the Turkish port of Ceyhan, providing access to the Mediterranean Sea (and European markets) without any reliance on the Strait of Hormuz or the Red Sea.
Current and potential pipelines in the Middle East
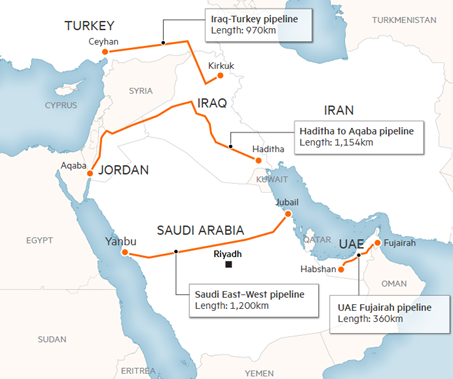
Source: FT Research, April 2026
Combined, we see the three routes allowing around 4-5m b/day of oil to be diverted away from the Strait of Hormuz.
3. Could the US protect ships transiting the Strait of Hormuz?
With pipeline capacity fully utilised, the only other way of securing large volumes of exports from the Gulf is via a ‘convoy system’ that would defend tankers passing through the Strait. A comparable effort was last seen for two months in 1987-1988 under Operation “Earnest Will”, when the United States helped to escort Kuwaiti tankers through the Strait. However, the protection was for Kuwaiti tankers only, came in small convoys and was carried out only once every few days. This time, a daily effort would likely be needed to protect all tankers and the combined oil and gas volumes for transit would be greater. We remain sceptical that such a system can be installed quickly or be maintained at a high capacity level. We also note the apparent lack of interest that the US has in such a solution, since the country is broadly neutral in its net imports/exports of crude oil and oil products (such as gasoline, diesel and jet fuel). To quote President Trump with regards to the Strait, “We don’t need it. We haven’t needed it, and we don’t need it” and subsequently “The United States imports almost no oil through the Hormuz Strait, and won’t be taking any in the future.”
4. Alternative supply: Strategic oil inventory and de-sanctioned Russian and Iranian volumes
The third route to increasing supply comes from the release of strategic and sanctioned barrels:
The first of these is the release of 400m bls of strategic oil and oil product inventory by the International Energy Agency (IEA)’s member countries, the largest ever release of strategic oil and oil product inventory. Total inventory capacity is around 1,500m barrels (defined as being a minimum of 90 days’ coverage of member country oil imports) while the United States’ Strategic Petroleum Reserve (SPR) is around 400m barrels (around 200 days of coverage of US net imports of crude oil).
While strategic inventories are large in volume, the key variable is the amount of oil that can flow daily from them. The most recent use of the IEA’s strategic inventories was after the Russian invasion of Ukraine in 2022. Over a period of around six months, the US released around 180m barrels, whilst the rest of the IEA released around 100m barrels. Combined, these strategic releases provided around 1.5m b/day of oil into the market.
There is also the question of what China might do. China has its own strategic oil reserve, which it has been building energetically since the start of 2025. The build over the last 12 months is thought be around 200m barrels. Flow rates from China’s reserves are unknown, but we would guess comparable to the IEA.
On this basis, we think that the strategic inventory release could provide the order of 2–3m b/day of additional oil and oil products.
- The second additional source is the de-sanctioning of Russian and Iranian oil that was ‘on the water’ in tankers at the start of 2026. We know little about the quality of this oil (gravity or sulphur content, for example) or the ability of the world refinery system to consume it. Nonetheless, it seems reasonable that this could be released into the market at a similar rate to the SPR releases, potentially adding a further 2m b/d of oil supply.
Conclusion: an energy shock bigger than the invasion of Ukraine in 2022
If we allow for the three pipeline diversions plus the strategic and de-sanctioned inventory releases described above, we see the world oil market as being currently undersupplied by around 10m b/day and potentially more if the proposed US blockade is fully implemented. This supply shock is far in excess of that contemplated by the market during the Russian invasion of Ukraine in 2022 and larger than the 5-7m b/day supply shocks that were suffered during the 1970s. This will persist while the Strait remains closed and, while a re-opening of the Strait would clearly improve the near-term supply outlook, the disruption would persist (on a declining scale) for perhaps two to three months while the industry returns to pre-war operation efficiencies. Depending on its duration, this supply disruption can only be solved by physical rationing of some kind – that is, demand destruction.
Moving towards an oil price that causes demand destruction
Oil-importing countries are now starting to witness physical oil and oil product shortages, since it takes around one month for oil exports from the Gulf to reach their ultimate destination. Inventories will act as a buffer, but demand will need to be destroyed (via higher prices) in order for the market to balance the physical loss of around 10m b/day (10% of total world oil supply).
As of late March, we are already starting to see Asian refiners cutting refinery runs and petrochemical volumes while air traffic and road traffic are running below trend levels. These are the first signs of the required demand destruction.
If the Strait of Hormuz remains closed, the oil market needs to find a price that incentivises the shut-in of a material amount of demand. This would require a price in excess of the current level ($110/bl on 7 April), and also well above our estimated demand destruction level of $120/bl, as this is simply a price that starts to cause more serious demand ‘pain’.
Economics of crude oil
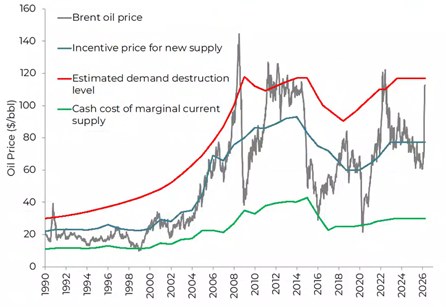
Source: Bloomberg, Bernstein, Guinness Global Investors, including estimates. Weekly data as of 31.03.2026
Put another way, oil would have to become a much larger burden on the world economy. On our new estimate of $90/bl Brent in 2026, oil would represent around 2.9% of world GDP, much lower than the levels reached during previous Middle East supply disruptions in the late 1970s (4-8%) or the level seen during the Global Financial Crisis in 2008 (5% of GDP). We believe that oil would need to increase to around $150/bl, reflecting nearly 5% of world GDP in 2026, if it were to have a noticeable negative impact on the global economy.
The world oil ‘bill’ as a percentage of GDP
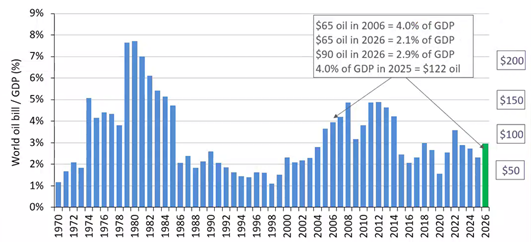
Source: IEA; Bloomberg; Guinness Global Investors, including estimates. April 2026
How have energy equities performed in this environment?
The Iran war has raised both near-term and long-term oil prices, thereby impacting company earnings estimates and equity valuations.
Considering the near term, we find that a $90/$80 Brent oil price scenario for the fund’s holdings in 2026/27 would see increases in earnings for producing companies of around 30-80% (versus our prior forecasts which assumed $65/oil). In this scenario, the fund’s total earnings per share rise by around 65% in 2026. This brings the fund’s price-earnings (PE) ratio down to around 13x in 2026, which compares to the long-run average PE of around 15x and the current MSCI World PE of around 20x for 2026.
PE ratios for key holdings in the Guinness Global Energy Fund
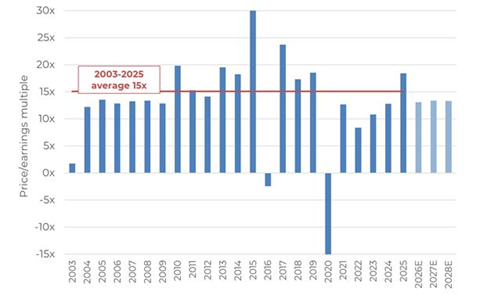
Source: Guinness Global Investors, April 2026
Assuming that these near-term extra cash flows are used to pay down debt or carry out share buybacks, we see them adding around 15-20% to share prices.
Looking longer-term, we note that the five-year forward Brent oil price has risen by around $7/bl year to date (from $65/bl to $72/bl at the end of March) reflecting pressure on the industry’s longer-term economics, resulting from sustained Middle Eastern supply risks. Based on our modelling work, we find that a $7/bl increase in long-term oil prices justifies a further 20% increase in share prices.
The two effects combined closely match the changes that we have seen in energy equity valuations this year. We conclude that the market today reflects a world of around $90/bl Brent in 2026, $80/bl in 2027 and then a long-term price of around $73/bl thereafter.
As we have previously written, we believe that $80/bl is a sensible long-term oil price in that it incentivises sufficient oil supply and demand over the next few years, whilst being ‘good enough’ for OPEC+ balance sheets. Were energy equities to reflect $80/bl long-term, with 2026 and 2027 estimates unchanged, there would still be a further 20% upside in energy equities.
Learn more about the Guinness Global Energy Fund
Disclaimer: This insight may provide information about Fund portfolios, including recent activity and performance and may contains facts relating to equity markets and our own interpretation. Any investment decision should take account of the subjectivity of the comments contained in this insight. This insight is provided for information only and all the information contained in it is believed to be reliable but may be inaccurate or incomplete; any opinions stated are honestly held at the time of writing but are not guaranteed. The contents of this insight should not therefore be relied upon. It should not be taken as a recommendation to make an investment in the Funds or to buy or sell individual securities, nor does it constitute an offer for sale.
Risk: The Guinness Global Energy Fund and WS Guinness Global Energy Fund are equity funds. Investors should be willing and able to assume the risks of equity investing. The value of an investment and the income from it can fall as well as rise as a result of market and currency movement; you may not get back the amount originally invested. The Funds are actively managed with the MSCI World Energy Index used as a comparator benchmark only.