Are we in an AI bubble?


What is a bubble?
First, let's address the 'bubble' part of the question. A bubble is simply a period when current asset prices greatly exceed their intrinsic valuation, often fuelled by excessive optimism and rampant speculation. Bubbles have taken many forms through history. Some are financial in nature: the South Sea speculation in the early 1700s, the stock market frenzy of the 1920s, and Japan’s 1980 real estate boom that saw such rapid land price appreciation that Tokyo’s Imperial Palace was briefly worth more than all Californian real estate.
Other bubbles are technological, driven by the promise of new and exciting breakthroughs: the 1840s railway build-out and of course the 1990s Telecom expansion which, at its peak, saw 70 million miles of excess fibre built only to lay unused underground. And, of course, some are pure speculation, best characterised by the 1630s tulip mania when certain bulbs went for up to 10,000 guilders (over half a million dollars in today’s money) despite their fleeting usefulness.
Why are investors talking about an AI bubble?
From tulips to artificial intelligence. The current optimism surrounding AI was catalysed by the launch of ChatGPT in November 2022. Whilst AI has arguably been around in some form or another since the 1950s (via ‘machine learning’, ‘expert systems’, and ‘neural networks’) it is only in the last few years that a more practical and user-friendly form has enabled broader uptake.
The chart below highlights the rapid adoption of large language models (LLMs), with ChatGPT weekly active users reaching c.800m just three years after launch, a milestone that took the internet 13 years to achieve. Even so, we remain in the early stages of AI adoption and considerable debate surrounds the full range of applications and use-cases.
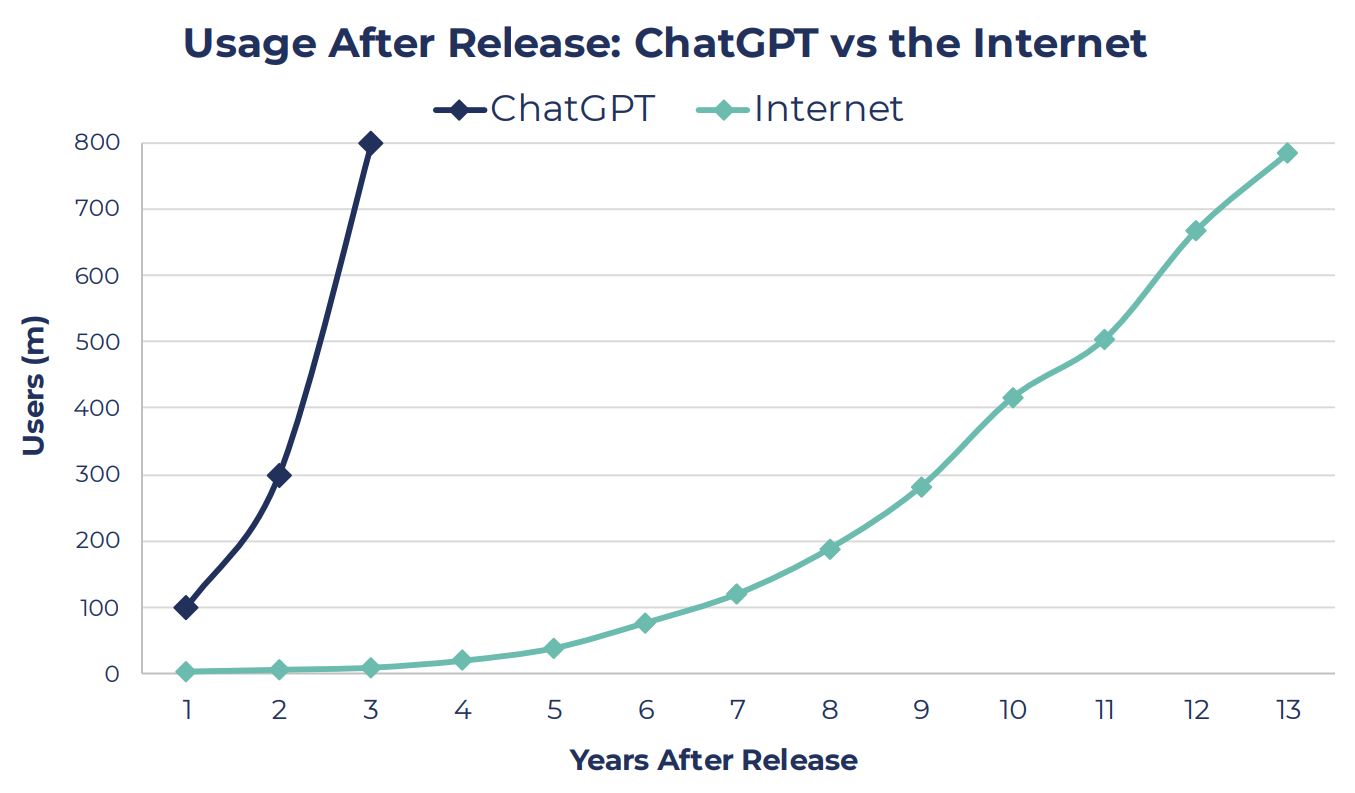
Source: FT, Guinness Global Investors as of 31st October 2025
As a result, major technology firms have committed unprecedented capital to build out the infrastructure that has the potential to support this next technological advance. Capital expenditure by the five largest hyperscalers (firms which operate data centres and provide cloud computing) will exceed $400bn this year and half a trillion dollars next year, as shown by the chart below.
Investors are starting to wonder where such staggering amounts will be allocated and what returns they will generate. In this insight, we will survey the AI CapEx landscape and weigh the arguments on both sides of the AI bubble debate to make sense of the narratives driving equity markets.
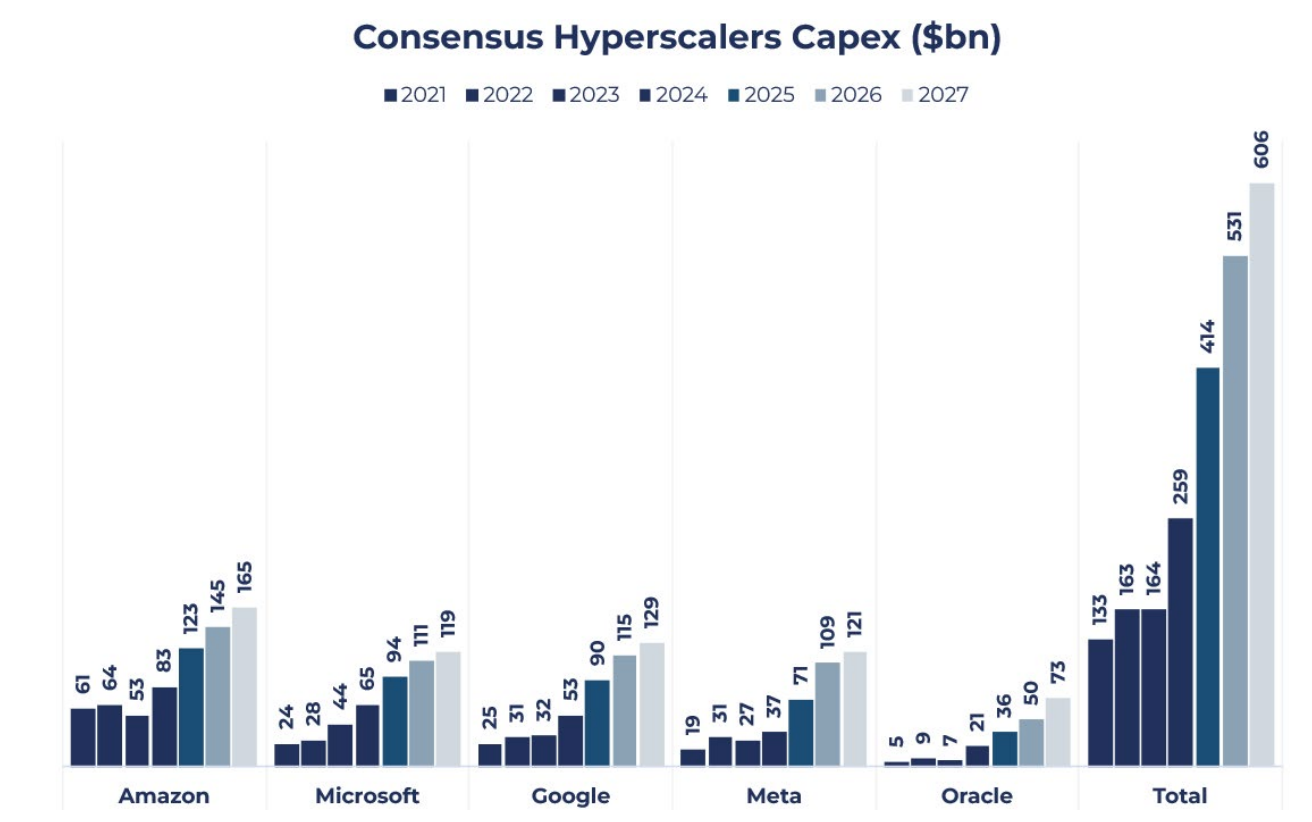
Source: Bloomberg, Guinness Global Investors as of 31st October 2025
The Case for an AI Bubble
This huge AI CapEx, then, is central to the case for a bubble, alongside the strong run in share prices this year for these stocks – and many others exposed to the theme. But there are other, related factors: the fact that CapEx expectations are not only large, but still rising fast; the potential for 'arms race' dynamics which push hyperscalers to overinvest; and a degree of circularity in the relationships between key AI companies. All point to the size of the 'bets' being placed on AI's future usefulness.
Hyperscaler AI spending
As the third-quarter reporting season began, hyperscalers' capital expenditure guidance emerged once again as the most closely watched metric, with markets betting on its implications for the continuation of the AI trade. The message from managements across these firms pointed to a strong imbalance between compute demand and supply, leading to increased CapEx expectations for the next few years.
As shown in the chart below, hyperscaler CapEx expectations for 2025 have risen from $288bn at the start of the year to $391bn in October. This upward trend is expected to continue in 2026, as demonstrated by Meta’s CEO Mark Zuckerberg, who noted the firm’s 2026 CapEx would be “notably larger” than in 2025, a prediction made by many of the leading firms.
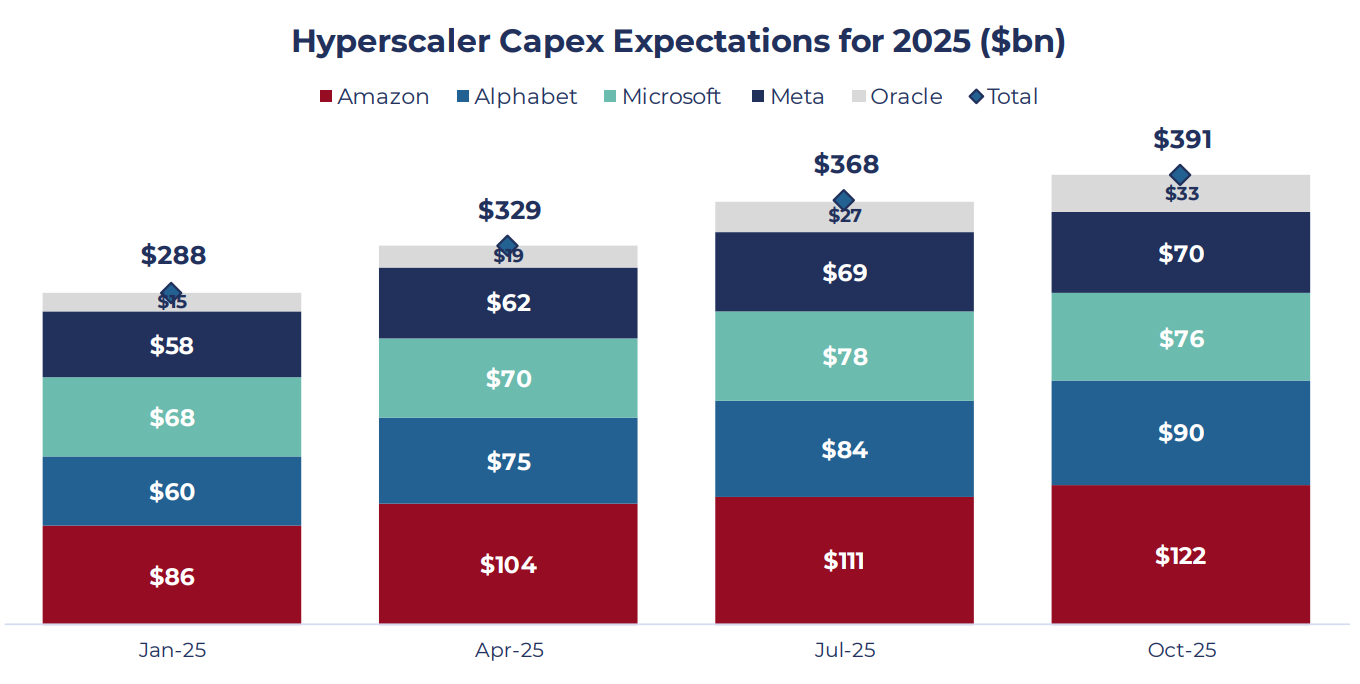
Source: Bloomberg, Guinness Global Investors as of 31st October 2025
Risk Asymmetry Favours Overinvestment
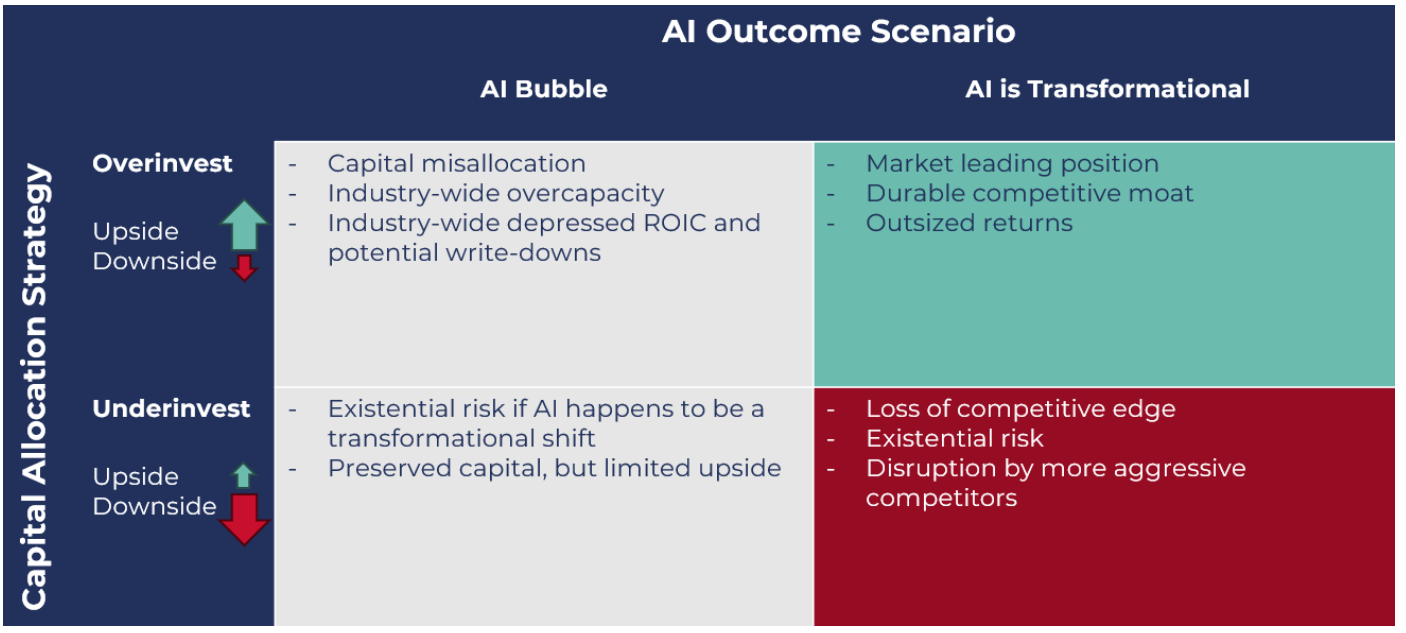
Taking a step back, a scenario assessment of capital allocation strategies might help to explain this growth in CapEx. If we consider the range of potential outcomes of underinvesting versus overinvesting, it appears that an overbuild of capacity may be the most probable outcome, driven by risk asymmetry.
In a potential AI bubble scenario, the downside of overinvestment is industry-wide overcapacity, leading to depressed returns on invested capital (ROIC) and potential write-downs, which tech giants are likely to be able to absorb.
However, the downside of underinvestment if AI becomes transformational is far more severe; this includes the risk of fundamental disruption, loss of competitive edge, and even existential risk to their business models (as shown by the red box in the bottom right corner below). Game Theory, therefore, suggests that leaning towards ‘overinvesting’ (the green box top right) would be the most logical strategy for companies to pursue.
Source: Guinness Global Investors as of 31st October 2025
AI Circularity
Another recent market development has been the growing number of circular partnerships among companies leading the infrastructure build-out.
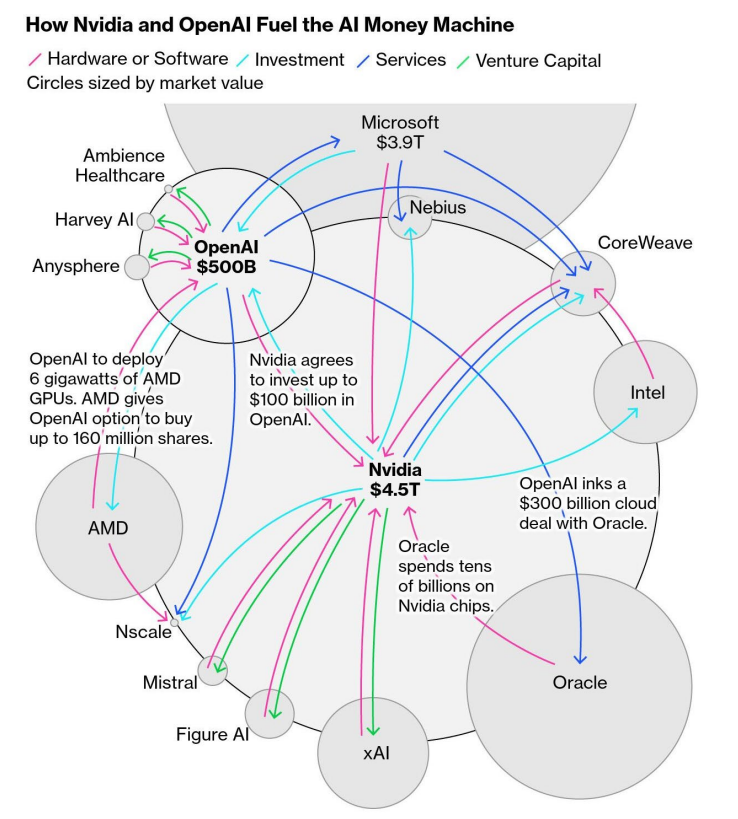
Source: Bloomberg as of 31st October 2025
At first glance, these transactions may appear to be a consequence of a complex and closely interlinked ecosystem. However, these deals between suppliers and customers are becoming increasingly creative, introducing a degree of systemic risk.
For example, AMD and OpenAI’s partnership saw the former agreeing to provide 6GW of GPUs and the latter issuing warrants for c.10% of the company in return (if certain purchase milestones are met). The news caused AMD's shares to jump 30%, more than offsetting the potential dilution and highlighting the euphoric market reaction to these creative circular deals. While some suggest these are more like frameworks, setting out a potential path forward as the AI build-out continues to ramp up, their size and quantum are starting to raise concerns.
For instance, OpenAI has made a staggering c.$1.5 trillion worth of cumulative spending commitments, underscoring its ambition to secure the necessary compute needed to develop frontier AI models. However, this figure contrasts starkly with its c.$13bn in annual revenues and $12bn loss in the last quarter, calling into question the feasibility of its spending.
Recently, CEO Sam Altman stated his ambitions to add 1 gigawatt (estimated to cost approximately $50 billion) of new capacity every week from 2030, equivalent to the output of a nuclear plant every seven days.
Why this could be an issue for investors
The current wave of AI CapEx is transforming many formerly asset-light tech companies into capital-intensive enterprises, which brings us to the capital cycle – and which stage we might be at.
The Capital Cycle
An acceleration in the infrastructure build-out by hyperscalers and neoclouds (cloud providers built specifically for AI and high-performance computing workloads) puts us in the phase of the capital cycle characterised by strong demand and the prospect of outsized returns. This serves to draw in new capital and leads to intensifying competition.
If the cycle unfolds like previous technology build-outs, rising competition and sustained capital inflows can often create excess capacity. This could lead to returns on investment (ROI) falling below the cost of capital, potentially resulting in write-downs. From a broader economic perspective, this can exacerbate market instability as firms reduce or withdraw investments in AI. However, the duration and depth of this cycle remain uncertain, and it may not necessarily follow historical patterns.
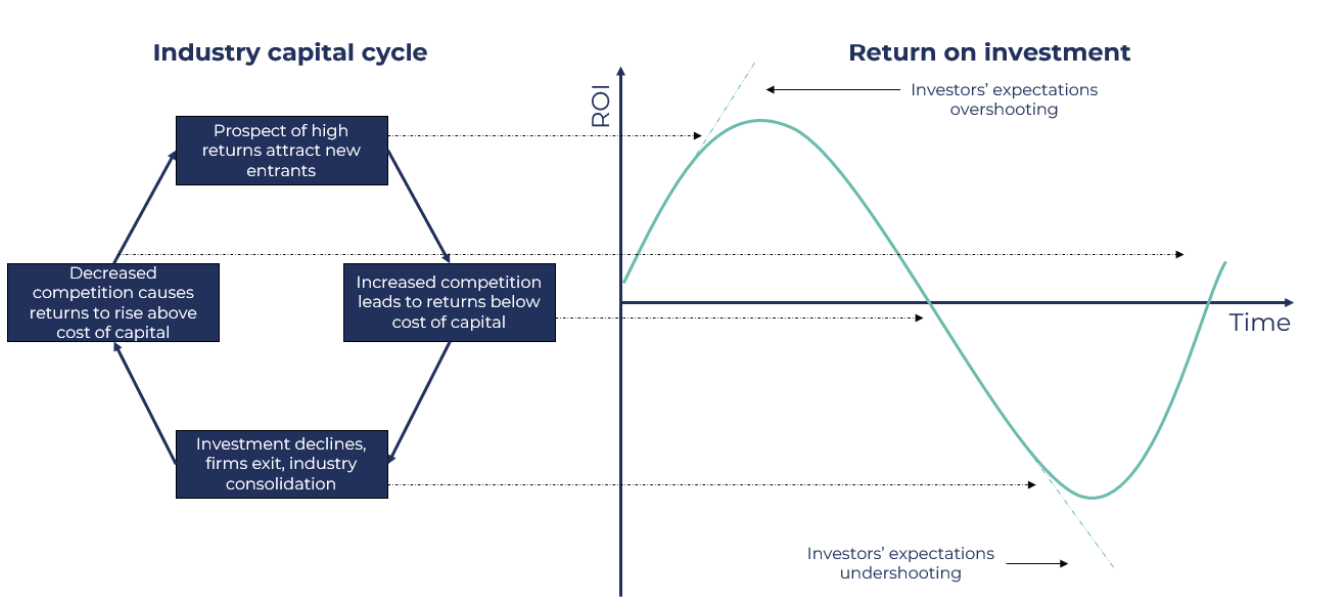
Source: Guinness Global Investors as of 31st October 2025
Rising Capital Intensity
Ten years ago, companies like Meta, Alphabet, and Microsoft were considered asset-light. Today, the race to secure the compute power necessary to develop and scale AI technologies is adding capital intensity.
The shift is reflected in declining free cash flow expectations (see below) as rising AI infrastructure spend outpaces near-term earnings contributions. Oracle warrants a special mention, with the market currently predicting it will generate negative cumulative free cash flow over the 2025-2029 period.
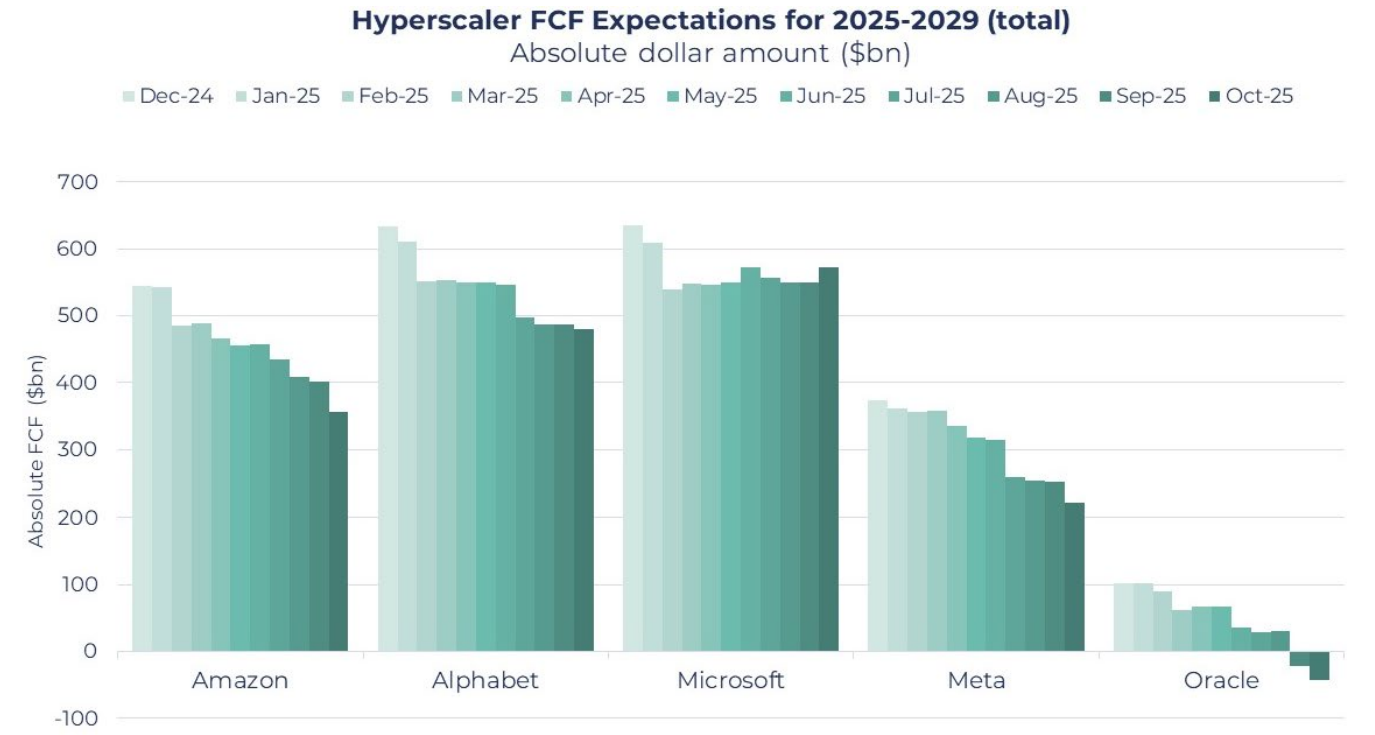
Source: Bloomberg, Guinness Global Investors as of 31st October 2025
Capital-intensive companies tend to have lower margins and need constant reinvestment to maintain their competitive position. Additionally, if this cycle does indeed follow previous technology booms, having to write down the value of these large investments in the future would hurt.
The Case for an AI Boom (Not a Bubble)
While bubbles thrive on abundant capital and accelerating narratives, a ‘boom’ may look very similar in its early stages (with rising valuations and accelerating investment) but, crucially, the fundamentals eventually catch up thanks to underlying cash flows, productivity gains, and genuine demand growth in the longer term.
At the moment, the situation is a clear imbalance between demand for AI and supply, and while that doesn’t necessarily mean there won’t be an investment overshoot, one could argue that booms eventually consolidate into durable industries with lasting economic value. And while investors continue to focus on the ‘ROI’ of these investments, there are early signs that AI is leading to meaningful business gains from Meta’s improved advertising algorithms, Microsoft’s enhanced software suite, and Amazon’s superior marketplace conversions thanks to its AI-powered shopping assistant.
Taken together, a strong case can be made that AI will lead to long-term productivity gains and economic improvements for many different firms and industries, ultimately justifying the substantial CapEx investments currently being made.
Can the US economy support this AI spending?
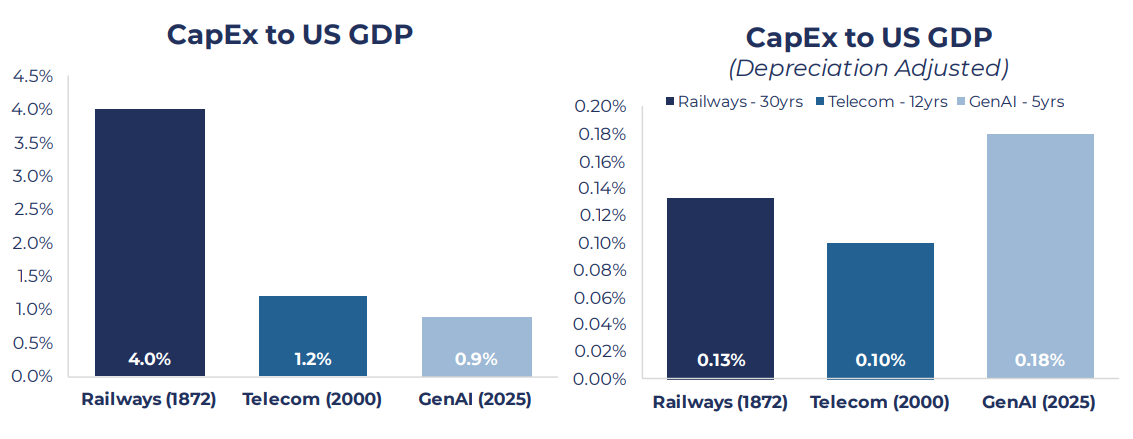
Some estimates put the overall AI CapEx spend at c.0.9% of US GDP (assuming c.70% of announced CapEx is spent in America). As shown by the chart below, this is a manageable figure when comparing to previous infrastructure investment cycles, particularly the railway and telecom build-outs, which ran at roughly 4% and 1.2% respectively.
That said, GPUs have relatively short lives given the pace of technological development. When adjusting for the depreciation cycle (annual spend / useful life) the current build-out looks slightly more aggressive.
Source: FRBSF, FRED, JSTOR, Synergy Research, Wired as of 31st October 2025
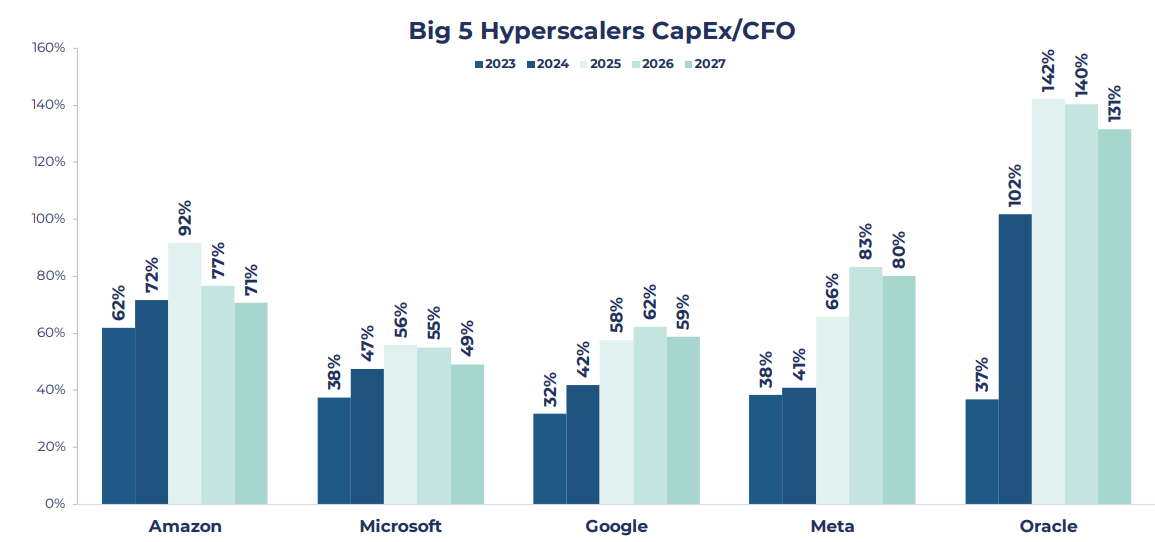
But there are reasons to still be optimistic. First, unlike previous investment cycles which have been more fuelled by debt and equity, much of the current build-out is being funded by free cash flow, a more sustainable and less systemically risky source. The chart below shows that, excluding Oracle, the other four hyperscalers can fund the forecast CapEx entirely out of their cash from operations.
Source: Bloomberg, Guinness Global Investors as of 31st October 2025
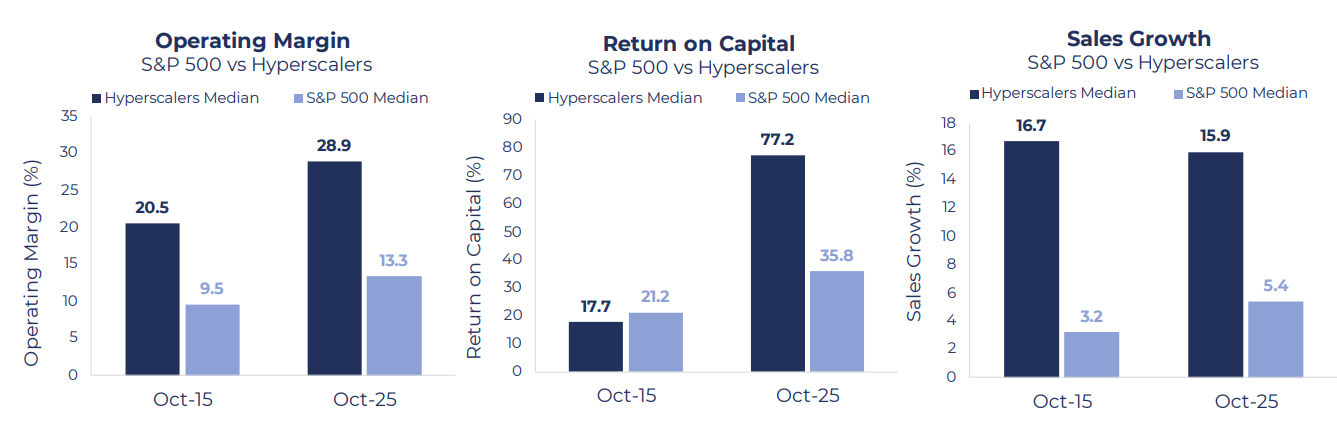
Moreover, the big tech companies funding the build-out remain very high-quality compared to the average S&P 500 company. As shown below, these firms can afford to make aggressive forward-leaning investments, with strong operating margins, healthy returns on capital and a strong sales growth outlook to fund the spending.
Source: Bloomberg, Guinness Global Investors as of 31st October 2025
How the present day differs from previous bubbles that have popped
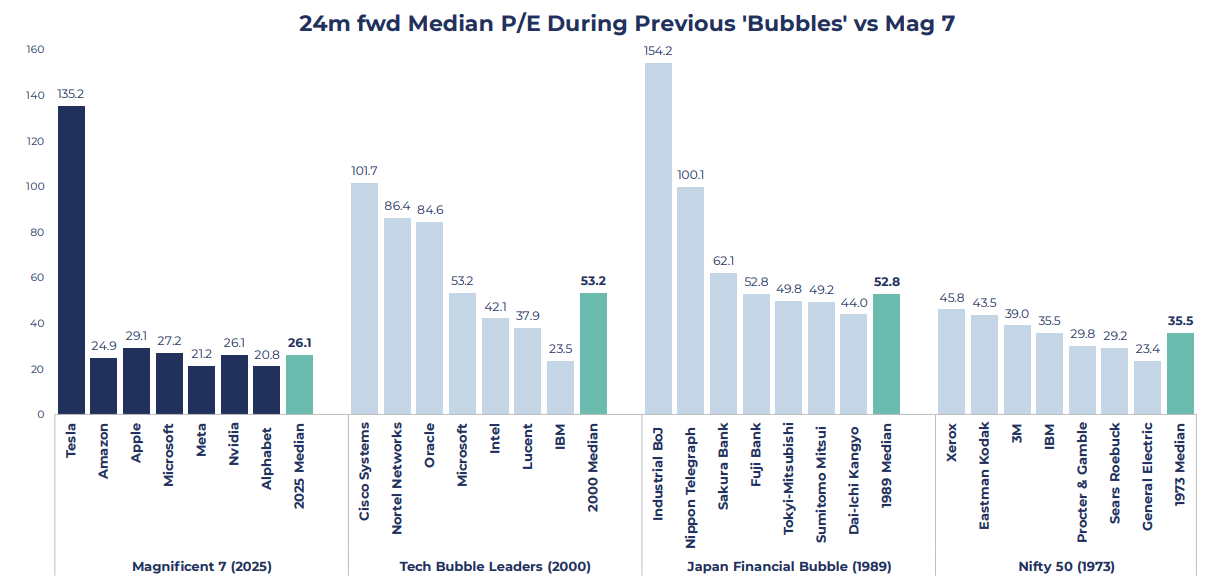
Today’s Magnificent 7 are at far more reasonable valuations than the seven largest index stocks in previous bubbles, three of which are shown below. Tesla remains the current outlier, with a 24-month forward price/earnings (PE) ratio over 135, but the other six are trading at justifiable levels given their growth and quality characteristics, with a median multiple of 26.1x.
Source: Goldman Sachs as of 31st October 2025
To take this analysis a step further, we can rank each of the 28 bellwether stocks shown above from highest to lowest valuation. Most of the Magnificent 7 remain cheap compared to past bubbles’ leaders, with the 2000 DotCom names and the 1980s Japanese Financial stocks looking substantially more expensive.
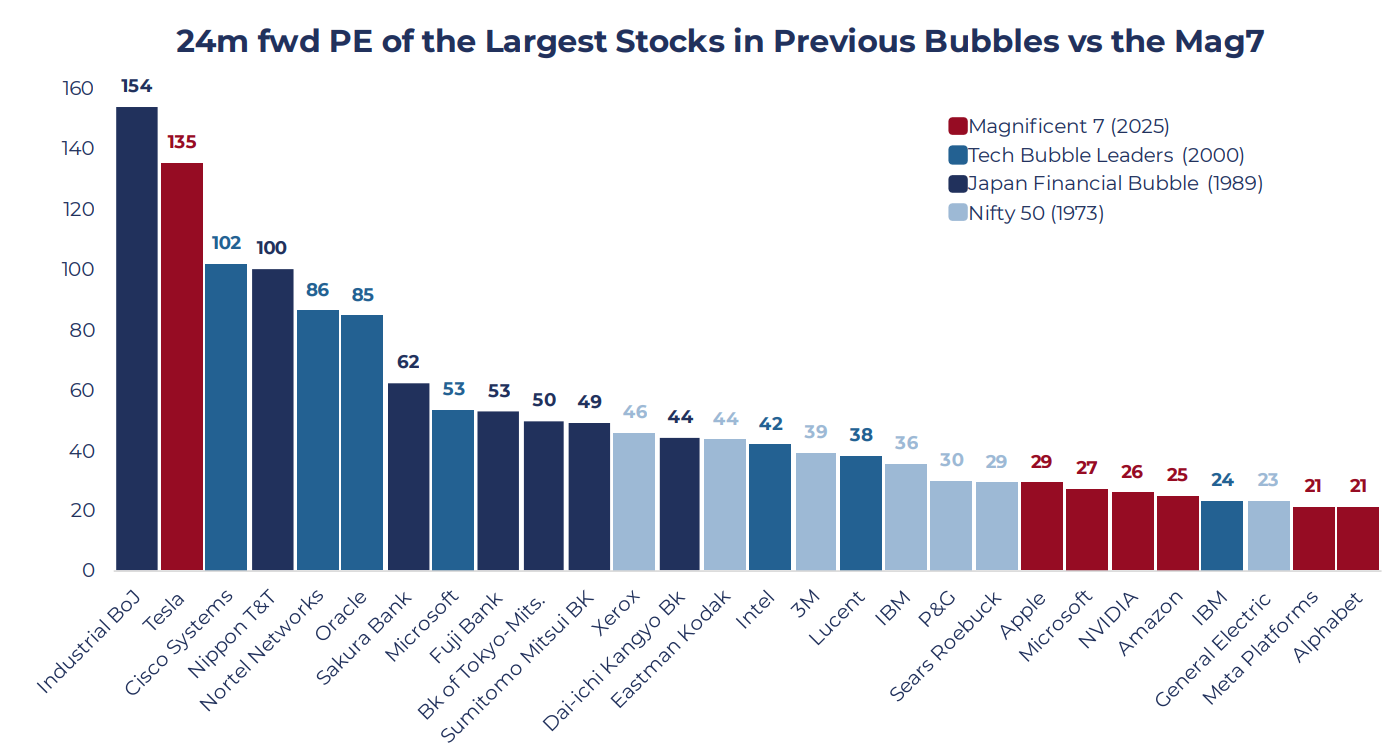
Source: Goldman Sachs as of 31st October 2025
Much of the market discourse year-to-date has centred around the oversized influence of the current market leaders. As it stands, the Magnificent 7 account for over 35% of the S&P500, a level of index concentration that exceeds that of previous market bubbles potentially leading to concentration risks, as discussed on a previous insight.
What is Guinness Global Investors' view?
By assessing both sides of the discourse, we can clearly see how different narratives have shaped investor sentiment. While we stop short of calling it a bubble, it is important to continue to monitor the growing rate of spending, circular partnerships, and debt financing, all key factors for the sustainability of the AI build-out.
The Guinness Global Innovators Fund takes an equal-weight approach, meaning that no individual security can dominate the portfolio and allowing us to mitigate the concentration risk seen in the current market. Additionally, our high-quality at fair-value investment philosophy naturally avoids the more speculative and volatile parts of the market that would most be affected by a value correction, while still taking advantage of the transformational potential behind AI.
Risk: The Guinness Global Innovators Fund and WS Guinness Innovators Fund are equity funds. Investors should be willing and able to assume the risks of equity investing. The value of an investment and the income from it can fall as well as rise as a result of market and currency movement; you may not get back the amount originally invested. The Funds are actively managed with the MSCI World Index used as a comparator benchmark only.
Disclaimer: This Insight may provide information about Fund portfolios, including recent activity and performance and may contains facts relating to equity markets and our own interpretation. Any investment decision should take account of the subjectivity of the comments contained in the report. This Insight is provided for information only and all the information contained in it is believed to be reliable but may be inaccurate or incomplete; any opinions stated are honestly held at the time of writing but are not guaranteed. The contents of this Insight should not therefore be relied upon. It should not be taken as a recommendation to make an investment in the Funds or to buy or sell individual securities, nor does it constitute an offer for sale.