How to view Chinese markets?


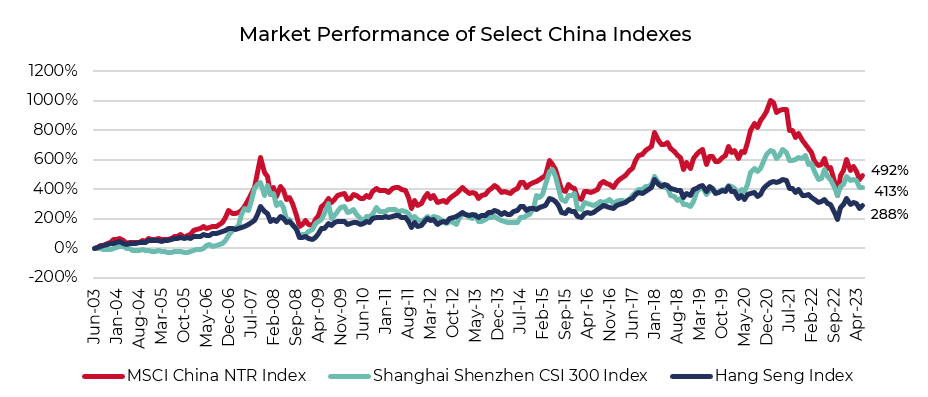
(Data from 30/06/03 - 30/06/23. Returns in USD. Source – Bloomberg, Guinness calculations)
In this paper, we go through the various markets in the Greater China region and discuss the major indexes used to measure performance. We then look at the broad indexes which cover all markets in China, highlighting the main differences between them. We argue that there is no ‘best’ index to measure performance in China and instead it is up to investors to pick the appropriate index for the exposures they would like to capture.
Hong Kong
Until A shares became more easily accessible in 2014, most investors received their China exposure through stocks listed in Hong Kong. Though A shares are now more popular, the Hong Kong stock market remains an important avenue for large, liquid stocks which give exposure to the mainland.
In Hong Kong, there are two main indexes: the Hang Seng Index and the Hang Seng Composite Index. Over the past 20 years, the difference in returns between the two has been notable; the Hang Seng Index has delivered a total return of 288% while the Hang Seng Composite Index has returned 346%.
Hong Kong Market Performance (USD)
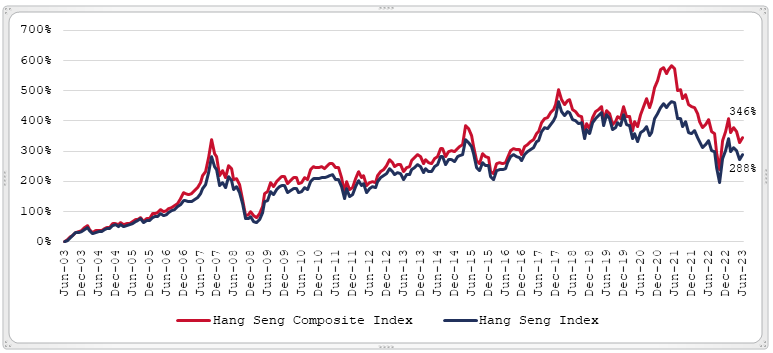
(Data from 30/06/03 - 30/06/23. Returns in USD. Source – Bloomberg, Guinness calculations)
The Hang Seng Index currently contains the largest 80 stocks (planned to be increased to 100) listed in Hong Kong, where any single stock is capped at an 8% weight. The index aims to give exposure to at least half of the market capitalisation in seven different industry groups (such as financials, information technology, or healthcare). The index also looks to hold 20-25 stocks that are classified as Hong Kong focused companies.
On the other hand, the Hang Seng Composite Index covers c.95% of the market capitalisation of companies on the Main Board of the Hong Kong Stock Exchange. It is not required to give exposure to each industry group and it does not need to ensure a minimum exposure to Hong Kong focused companies. Stocks are capped at a 10% weight. Both the Hang Seng Index and the Hang Seng Composite Index are free float adjusted.
| Hang Seng Index | Hang Seng Composite Index | |
| No. of stocks | 80 (will be increased to 100) | 528 |
| Single Stock Cap | 8% | 10% |
| Market Value | Mid and Large Cap | All Cap |
Below we show industry weights for both indexes, where both have large exposures to Financials and Information Technology. The Hang Seng Index has a 5.8% higher weight to Financials and a 1.7% higher weight to Information Technology. On the other hand, the Hang Seng Index has a 2.8% lower weight to Consumer Discretionary.
Industry Weightings
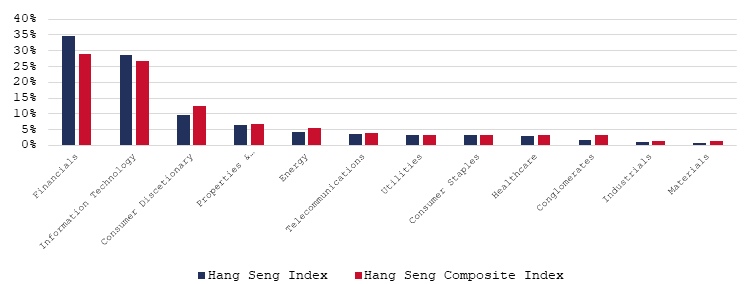
(Data as of 30/06/23. Source – Hang Seng Indexes factsheets)
American Depository Receipts (ADRs)
There are also Chinese stocks trading as American Depository Receipts (ADRs) in the United States. A few of these ADRs have been trading for decades, such as Netease. Others listed nearly a decade ago (e.g. Alibaba and JD.com), while a batch listed around 2018 (e.g. Pinduodo and Nio). In response to delisting risk, which for now has abated, most of the largest stocks now have a dual listing in Hong Kong.
Based on the holdings of the NASDAQ Golden Dragon China Index, we see 54.3% of the index is in Consumer Discretionary Stocks and 23.5% is in Communication Services. The largest Consumer Discretionary stocks are Pinduoduo (7.8% weight), Alibaba (7.6%), JD.com (7.3%), Trip.com (6.6%) and Nio (4.7%). The largest Communication Services stocks are Baidu (8.1%) and Netease (4.1%).
Sector Weightings for ADRs
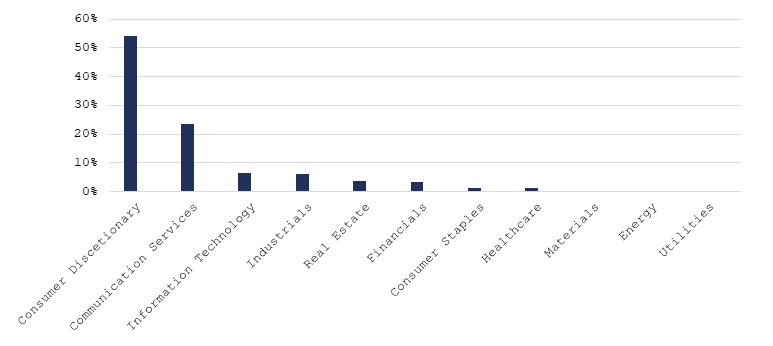
(Data as of 30/06/23. Using the Invesco Golden Dragon China ETF (PGJ US Equity) as a proxy for the NASDAQ Golden Dragon China Index. Source – Bloomberg, Guinness calculations)
A Shares
China A shares refer to stocks listed in mainland Chinese markets (“onshore markets”). The largest A share exchanges are the Shanghai and Shenzhen exchanges. Until 2014, onshore markets were hard to access for foreign investors, as they had to sign up through the Qualified Foreign Institutional Investor (QFII) and Renminbi Qualified Foreign Institutional Investor (RQFII) schemes. These schemes had quotas and restrictions which made A shares less attractive. In 2014 that the Stock Connect scheme was launched, allowing foreign investors to buy A shares through accounts in Hong Kong. Many barriers to investing in A shares were eliminated through the Stock Connect, making them a viable asset class for sophisticated, institutional investors.
As with the offshore market, there are several indexes designed to measure performance in the onshore market. Most domestic investors use the CSI 300 Index, which captures the largest 300 stocks on the Shanghai Stock Exchange and Shenzhen Stock Exchange. Many foreign investors prefer to use MSCI indexes. The MSCI China A Index captures large and mid-capitalisation A shares that are available through the Stock Connect. The MSCI China A Onshore Index also captures large and mid-capitalisation stocks in onshore markets but, critically, it does not take into account availability through the Stock Connect. It therefore gives a better picture of the opportunities available to domestic investors.
Looking at the past five years, the returns of the three onshore indexes has been different. The CSI 300 Index has returned 11%, the MSCI China A Index has returned 19% and the MSCI China A Onshore Index has returned 14%.
Market Performance of Select A Share Indexes
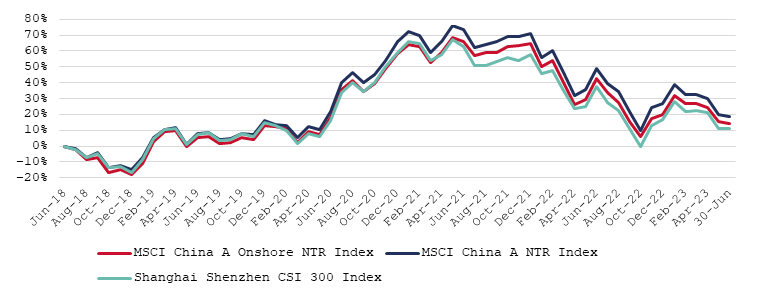
(Data from 30/06/18 - 30/06/23. Returns in USD. Source – Bloomberg, Guinness calculations)
Across the three indexes, the largest sectors are Financials, Information Technology, Industrials and Consumer Staples. Relative to the CSI 300 Index, the MSCI China A Onshore Index has 3.1% more exposure to Materials and 4.1% less exposure to Financials.
Sector Weightings for A Share Indexes
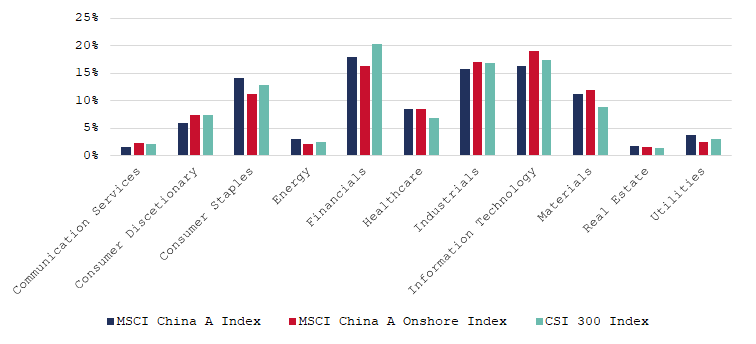
(Data as of 30/06/23. Using the iShares Core CSI 300 ETF (2846 HK) as a proxy for the CSI 300 Index. Source – MSCI, Bloomberg, Guinness calculations)
Measuring Performance Across Markets
For a broad measure of how Chinese markets are doing, many use the MSCI China Index. This captures large and mid-capitalisation Chinese companies, covering those listed in Hong Kong and the US as well as in onshore markets. For this index, note MSCI only includes 20% of the market capitalisation of A shares in its calculations (this number is called the inclusion factor). Since the A shares are not fully accounted for, there is a high level of concentration within the MSCI China Index. Tencent and Alibaba have a weight of 12% and 9% respectively. For context, in the MSCI United States Index the top two stocks are Apple and Microsoft with a weight of 8% and 6% respectively. In the MSCI Europe Index, the largest stocks are Nestlé and ASML with a weight of 4% each.
For those who want exposure to China with A shares fully accounted for, the MSCI China All Shares Index is of interest. It includes the full market capitalisation of A shares, therefore reducing Tencent’s and Alibaba’s weights to 8% and 5% respectively. The full inclusion of A shares is significant, as under the MSCI China All Shares Index, A shares have a 50% weight, whereas in the MSCI China Index, they only have a 17% weight.
Index Breakdown by Market
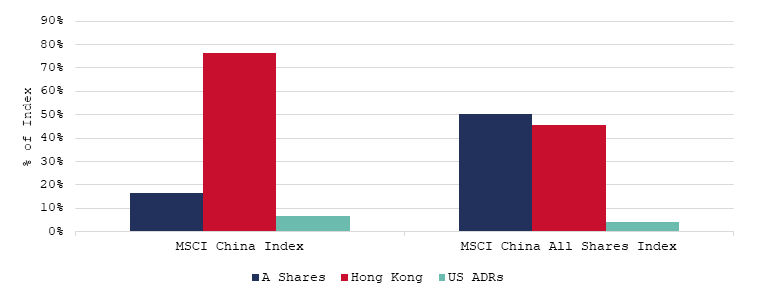
(Data as of 30/06/23. Source – MSCI, Bloomberg, Guinness calculations)
The MSCI China All Shares Index has 11.2% less exposure to Consumer Discretionary and 5.6% less exposure to Communication Services, reflecting the lower weights of Tencent (Communication Services) and Alibaba (Consumer Discretionary). On the other hand, the is 4.6% more exposure to Information Technology and 4.1% more exposure to Industrials.
Sector Weightings for Broad China Indexes
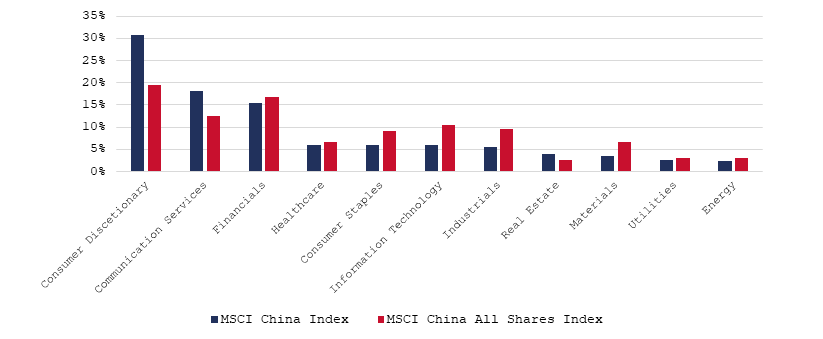
(Data as of 30/06/23. Source – MSCI)
Within the MSCI China All Shares Index, we also find it helpful to breakdown sector exposure by market. For example, as we show below, most of the Communication Services exposure within China is found in Hong Kong through companies such as Tencent, Netease and Baidu. Most of the Consumer Staples exposure is found in onshore markets through A shares, as these are where alcoholic drinks companies are listed. Indeed, it is clear that A shares represent much of the opportunity set in Health Care, Industrials, Information Technology and Materials.
Sector Breakdown of MSCI China All Shares Index (By Country of Listing)
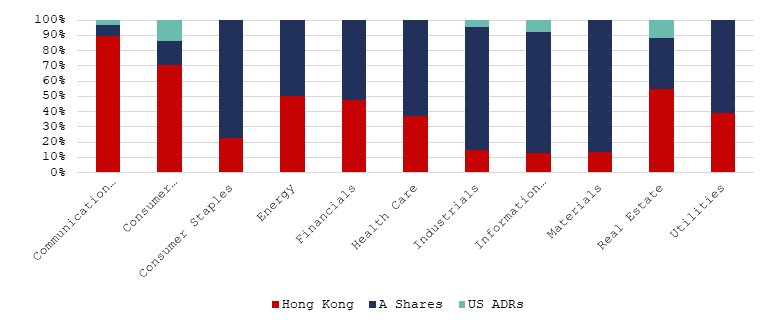
(Data as of 30/06/23. Data market capitalisation weighted. For dual listed ADRs, the Hong Kong line is counted as the primary listing by MSCI. Source – MSCI, Bloomberg, Guinness calculations)
For those looking for exposure to Taiwan, the MSCI Golden Dragon Index is relevant. It is a weighted average of the MSCI China, MSCI Taiwan and MSCI Hong Kong indexes. Since it uses the MSCI China Index and not the MSCI China All Shares index, it also only includes 20% of the market capitalisation of A shares. Including Taiwan changes exposures significantly; for example, in the MSCI China Index, Hong Kong listed shares have a weight of 77% whereas in the MSCI Golden Dragon Index they have a weight of 55%. Due to the strong recent performance of Taiwanese markets relative to mainland Chinese markets, Taiwan accounts for 31% of the MSCI Golden Dragon Index.
Index Breakdown by Market
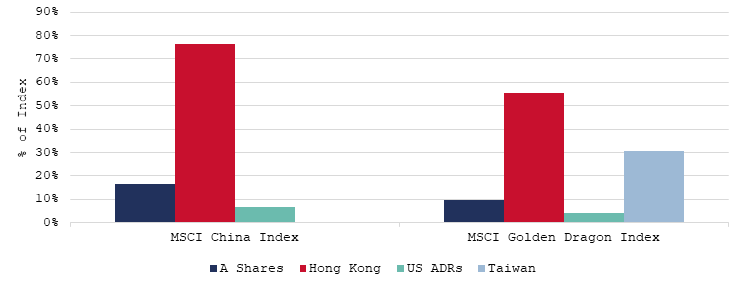
(Data as of 30/06/23. Source – MSCI, Bloomberg, Guinness calculations)
Information Technology accounts for 72% of the Taiwan Index, so relative to the MSCI China Index, the MSCI Golden Dragon Index has 19.6% more exposure to Information Technology and 12.8% less exposure to Consumer Discretionary. The addition of Taiwan gives the MSCI Golden Dragon Index exposure a range of companies in the semiconductor supply chain, ranging from foundries such as TSMC to chip designers such as Novatek Microelectronics and component manufacturers like Elite Material.
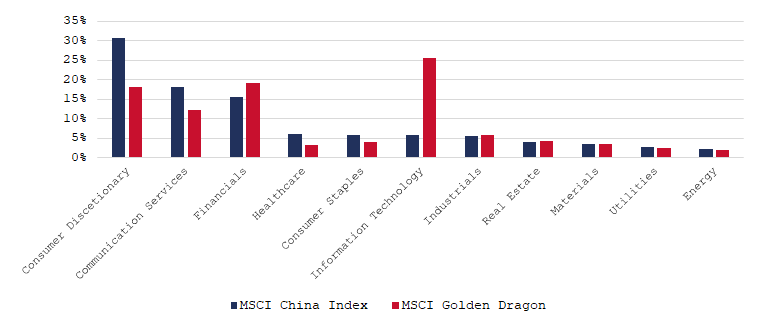
(Data as of 30/06/23. Source – MSCI)
Conclusion
Given the various markets in China, we argue it makes sense to use a broad index covering both onshore and offshore exchanges in China. Alone, one of the Hang Seng indexes, or one of the A share markets, is no longer reflective of the overall opportunity set in China. The MSCI China Index is the most popular benchmark for foreigners, but investors should be aware of the 20% inclusion factor applied to A shares. This means within this index, there is a large degree of stock-specific risk. For those looking to fully take into account A shares, the MSCI China A Onshore Index is the most reflective of the opportunity set in mainland China. Finally, the MSCI Golden Dragon Index is appropriate for those who want additional exposure to the Taiwanese market. We argue there is no “best” index to measure performance in China. It is instead up to investors to pick the appropriate index that gives the exposures they would like to capture.
Summary Tables
Offshore
| Hang Seng Index | Hang Seng Composite Index | Nasdaq Golden Dragon China Index | |
| No. of stocks | 80 (will be increased to 100) | 528 | 73 |
| Top Five Stocks Weighting | 38% | 32% | 37% |
Onshore
| CSI 300 Index | MSCI China A Index | MSCI China A Onshore Index | |
| No. of stocks | 300 | 543 | 838 |
| Top Five Stocks Weighting | 15% | 13% | 11% |
All China
| MSCI China Index | MSCI China All Shares Index | MSCI Golden Dragon Index | |
| No. of stocks | 717 | 794 | 880 |
| Top Five Stocks Weighting | 32% | 20% | 32% |
| Exchenges Covered | Hong Kong, ADRs and 20% of market cap of mid-to-large cap A shares | Hong Kong, ADRs and 100% of market cap of mid-to-large cap A shares | Hong Kong, ADRs, 20% of market cap of mid-to-large cap A shares, and Taiwan |
Disclaimer: This Insight may provide information about Fund portfolios, including recent activity and performance and may contains facts relating to equity markets and our own interpretation. Any investment decision should take account of the subjectivity of the comments contained in the report. This Insight is provided for information only and all the information contained in it is believed to be reliable but may be inaccurate or incomplete; any opinions stated are honestly held at the time of writing but are not guaranteed. The contents of this Insight should not therefore be relied upon. It should not be taken as a recommendation to make an investment in the Funds or to buy or sell individual securities, nor does it constitute an offer for sale.