Emerging Markets Dividend Investing


Past performance does not predict future returns.
Introduction
Dividend investing has powerful advantages when accessing the diversification and growth that emerging markets offer. As in other regions, dividends provide a strong signal as to the underlying health of emerging market companies. Income, under our approach, is the output of a successful, high-quality company that is generating cash. Elevated profitability, in cash-based terms, when combined with a strong balance sheet, provides the means to reward shareholders with dividends, while meeting the reinvestment requirements of the business. The converse is also true: where a previously steady stream of dividends has been forsaken by management, the underlying health of the business should be questioned and subject to additional scrutiny.
An emerging markets equity income approach therefore provides the opportunity to invest in a certain class of companies. Seeking income steers you towards a part of the market that delivers a particular type of return profile to the end investor. A useful bonus is that emerging markets offer, at the time of writing, a level of income that exceeds that of most other markets.
Our definition of quality – sustained returns, consistently above the cost of capital – enables us to define an investment universe that excludes many of the highly cyclical names that are so prevalent in emerging markets. Investors therefore have access to a very different set of opportunities than a more typical (and often more volatile) emerging market approach.
This style contrasts with using emerging markets as a vehicle to ride the business cycle. We do not make cyclical ‘calls’. Instead, we ask a different question: where can we find companies which we expect will continue to generate strong returns, but are being priced by the market as if they won’t? This ‘company first’ approach means we consider macro factors in the context of the effect they have on individual businesses. This approach is very different to the typical emerging market investment practice of basing top-down allocations on which regions or countries look attractive at the time.
Emerging markets investing doesn’t have to be a rollercoaster: investors can still benefit from the diversification of that emerging market equities provide by moving in a differentiated form from developed markets, while tapping into the superior structural growth that emerging market economies offer.
Our Approach to Dividend Investing
Quality Mindset
A good investment begins with a good company. We use Return on Capital (ROC) as a measure to assess the quality of a business. When assembling our investment universe, we look for companies that have a track record of ROC being consistently higher than the cost of capital.
In the case of the Emerging Markets Equity Income strategy, we screen for companies that have returned at least an 8% real return on capital for each of the past eight years. This requirement eliminates almost 90% of companies from the investment universe.
Capital Allocation & Reinvestment for Growth
How a company uses the cash it is generating and how future capital is allocated becomes a crucial part of our analysis.
Our preference is to see a balance between rewarding shareholders with dividends and reinvesting in the business for growth. We find that quality companies in our universe often tend to deliver growth that is both profitable and more consistent than those in the wider universe.
By focusing on superior returns on capital, we define an investment universe that sees higher revenue growth, profit growth and dividend growth over time.
Dividends as a Health Signal
Dividends can be useful in communicating the condition of the business. Any disruption to the dividend, therefore, provides an important clue that something has gone awry in the underlying process of cash generation.
Dividends also play at important role in demonstrating accounting integrity. Over time, we should see a link between growth at the top line, growth at the bottom line, and corresponding growth in dividends.
Returns for Shareholders
Part of a shareholder’s return can come from valuation rerating, but part should come from earnings and growth of the business. We are conscious not to overpay for any given stock, but we generally expect the fundamental returns of the business to dominate overall shareholder returns, particularly over the medium to long term.
For shareholders, the process of reinvesting dividends can have an extraordinary impact on total returns. By putting dividends back to work in companies that are growing, those dividends can be further compounded. Over long periods of time, reinvested dividends can account for a substantial portion of overall shareholder returns.
Portfolio Construction
Our portfolio of 36 approximately equally weighted stocks ensures that all positions have the potential to contribute meaningfully to performance. We operate the portfolio on a ‘one in, one out’ basis.
The income distribution across the portfolio is diversified and reasonably broad, with each stock in the portfolio making a contribution. We don’t operate a barbell process, whereby only a portion of the portfolio contributes to income and the remainder is invested in non-dividend paying growth stocks.
Quality Mindset
A good investment begins with a good company. High-quality businesses exhibit characteristics such as competitive advantages, whether they are in the form of unique products, efficient cost structures, superior management, or intellectual property, based on a sound financial platform.
We use Return on Capital (ROC) to assess the quality of a business and look for companies that have a track record of ROC being consistently higher than the cost of capital. This approach focuses on creating wealth that is capable of supporting future expansion and generating growing cash flows for shareholders.
In the case of the Emerging Markets Equity Income strategy, we look for companies that have returned at least an 8% real return on capital for each of the past eight years. This requirement eliminates almost 90% of companies from the investment universe, and specifically those with the following features:
- Negative or mediocre returns
- Excessively cyclical returns
- An insufficient track record
We then add two further criteria to our screening process. A company’s market capitalization must be at least $500 million to make it easy enough to invest in, and it must not be overly indebted. These narrow our investible universe to around 500 companies with an average nominal return on capital of 17% since 2010. Historic data for this universe shows that it is an excellent starting point when selecting a portfolio of high-quality companies.
The following chart shows return on capital over time for the universe compared with the benchmark:
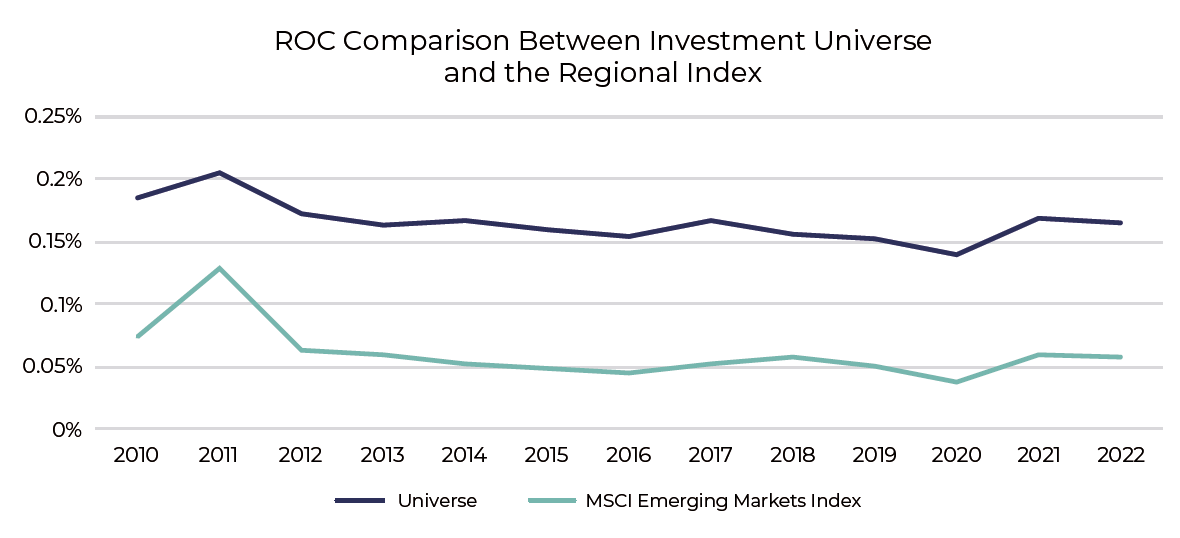 Regional Index is the MSCI Emerging Markets Index. Source: Data from Bloomberg, Universe names from Guinness Global Investors. 31.12.2010 to 31.12.2022
Capital Allocation & Reinvestment for Growth
Companies that earn high rates of returns have the welcome problem of what to do with the cash. How that capital is used and how future capital is allocated forms a crucial part of our analysis.
Companies that have earned high returns on capital demonstrate that management have allocated capital judiciously. Such companies often have attractive opportunities to reinvest in projects with high returns that exceed the cost of capital.
The importance of a company reinvesting in the business cannot be understated. Over long periods of time, it is the reinvestment of profits that drives future growth in the business. The growing capital base of the business supports growth in the top line, and feeds into a growing earnings stream and (assuming a stable dividend policy) a growing dividend stream.
When faced with decisions about which projects to reinvest in, management should, in our view, stick to what they know well. If a company has earned high returns in the past, the probability that they will do so in the future is much higher if it does not attempt to move into a very different line of business from its current operations. Large-scale M&A, so-called ‘transformative’ acquisitions, can work, but these tend to be the exception. Too often the transformation is a detrimental one. Similarly, management should be careful not to overpay, resulting in poor future returns on the capital invested.
Our preference is to see a balance between rewarding shareholders with dividends and reinvesting in the business for growth. We find that our universe of quality companies often tends to deliver growth that is both profitable and more consistent than found in the wider universe. Indeed, companies with the highest level of expected growth often disappoint when it comes to realizing this growth later.
Crucially, when paired with our focus on superior returns on capital, we end up with a universe which over time sees higher revenue growth, profit growth, and dividend growth.
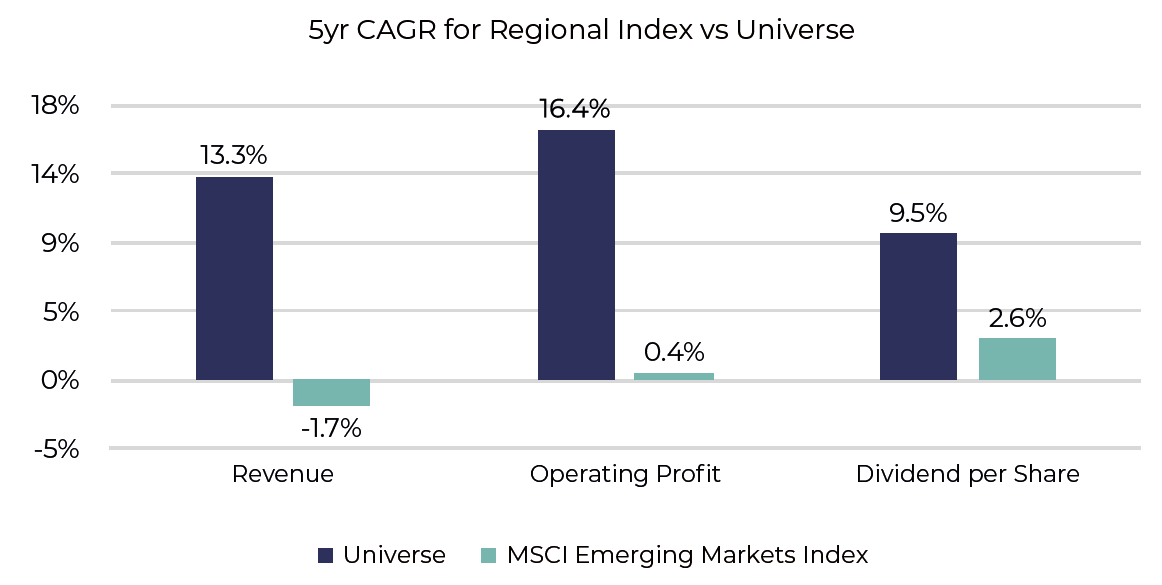
Regional Index is the MSCI Emerging Markets Index. CAGR: compound annual growth rate.
Source: Data from Bloomberg, Universe names from Guinness Global Investors. 31.12.2017 to 31.12.2022
If we look at the region, we can see individual regions differ in their balance between payout ratio and growth:
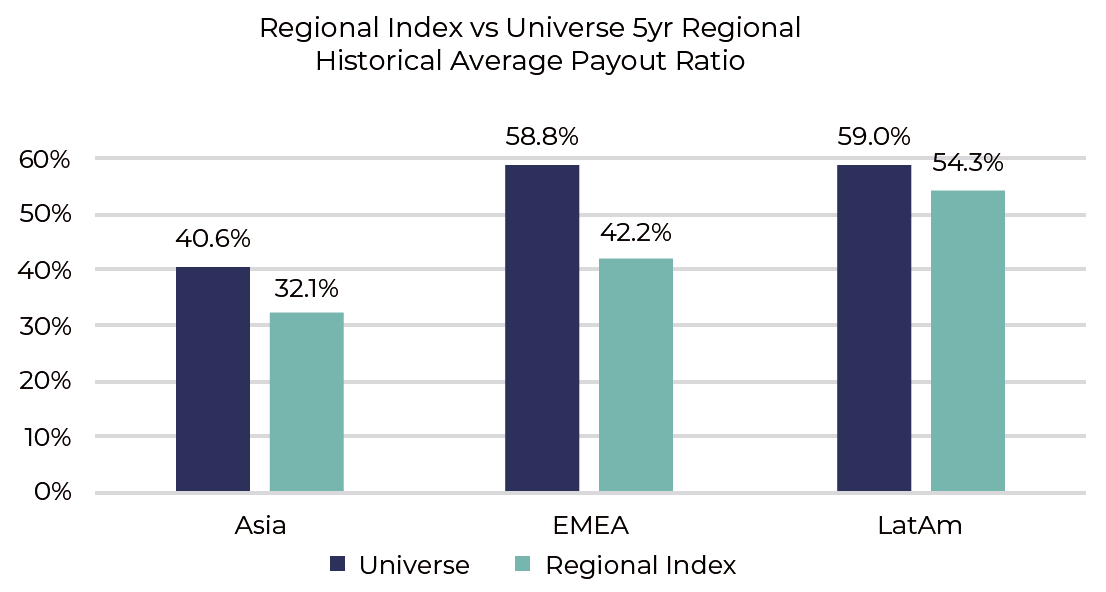
Regional Index uses data from the corresponding MSCI Emerging Markets regional index. EMEA:
Europe, the Middle East & Africa.
Source: Data from Bloomberg, Universe names from Guinness Global Investors. 31.12.2017 to 31.12.2022
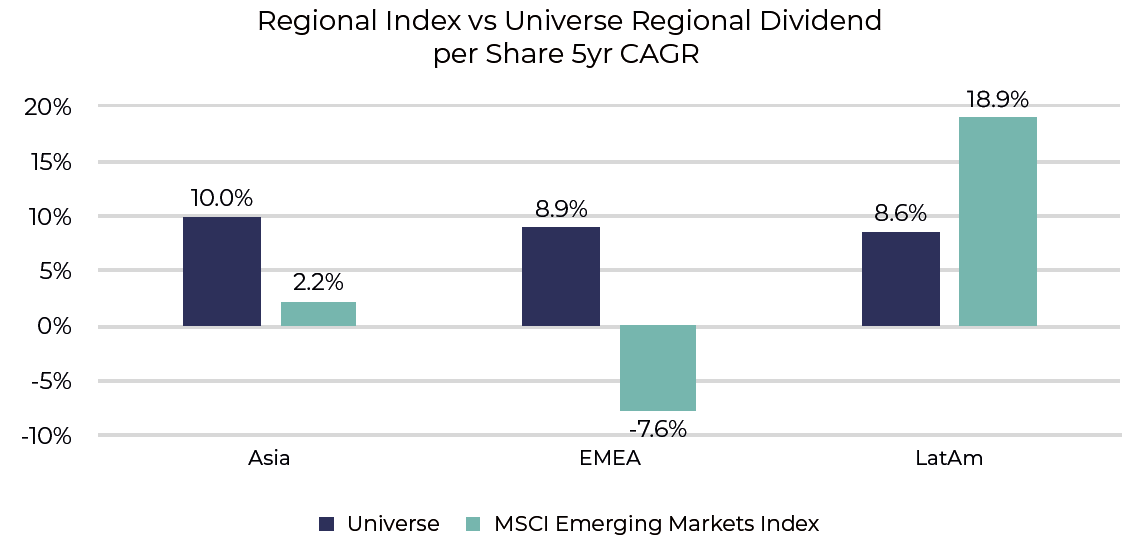
Regional Index uses data from the corresponding MSCI Emerging Markets regional index.
Source: Data from Bloomberg, Universe names from Guinness Global Investors. 31.12.2017 to 31.12.2022
While Latin America has the highest payout ratio, it also has by far the highest growth rate of the three regions. Europe, the Middle East, and Africa (EMEA), despite having a similar payout ratio, has seen dividends contract over the period. Asia has the lowest payout ratio, but growth has been relatively lacklustre.
In all regions, the universe has outgrown the regional indices, despite the higher payout ratio. Not surprisingly then, the universe overall has grown dividends at a higher rate than the benchmark, and maintained a higher payout ratio:
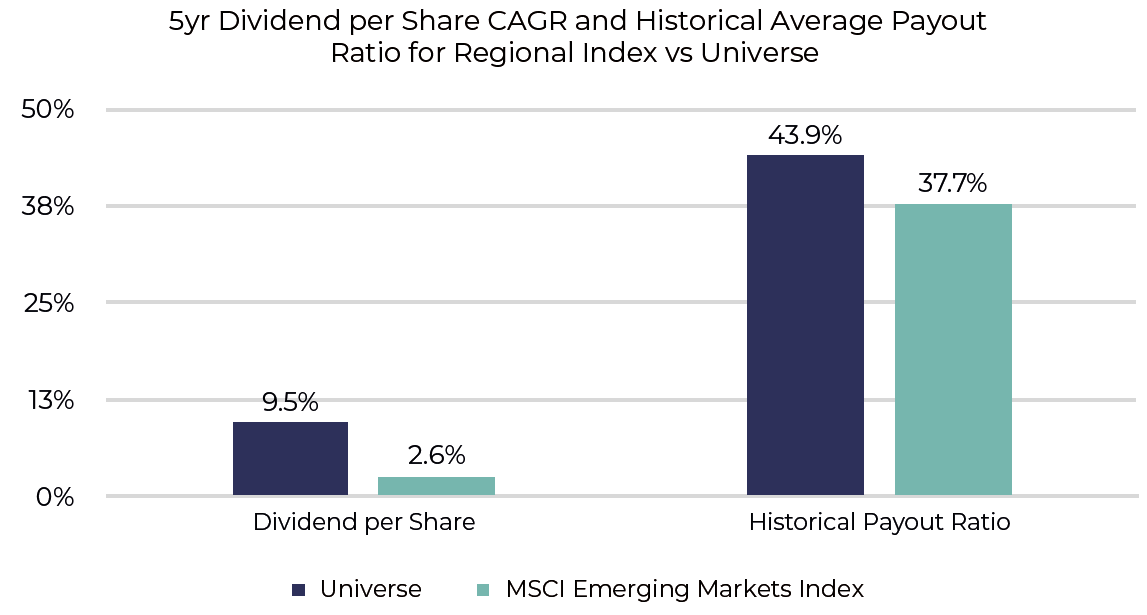
Regional Index is the MSCI Emerging Markets Index.
Source: Data from Bloomberg, Universe names from Guinness Global Investors. 31.12.2017 to 31.12.2022
Therefore it has been possible to find attractive levels of growth among income-paying stocks. Investors need not sacrifice the structural growth that the region offers by allocating to this segment of the market.
Generally, we have found a payout ratio of around 50% to be about the right level for the portfolio overall – balancing dividend payouts and earnings retention. Dividend growth for the portfolio companies is in line with that of the universe (despite a higher payout ratio), as the following chart shows:
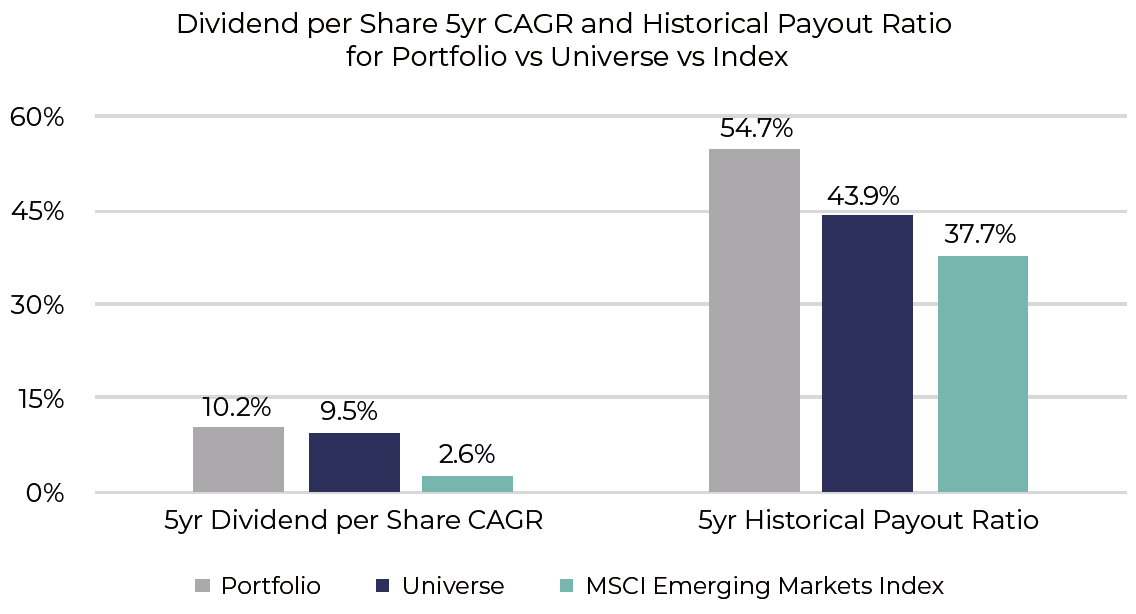
Regional Index is the MSCI Emerging Markets Index.
Source: Data from Bloomberg, Portfolio and Universe names from Guinness Global Investors. 31.12.2017
to 31.12.2022
Dividends As A Health Signal
Dividends play an important role in signaling the underlying health of the business. We believe the businesses we are investing in – companies with attractive returns on capital in cash-based terms – should be able to return some of their cash to shareholders. Any disruption to this dividend, therefore, provides an important clue that something has gone awry in this underlying process of cash generation.
As such, we view dividend growth to be the ultimate mark of success, and we can see how the universe companies have grown dividends over time:
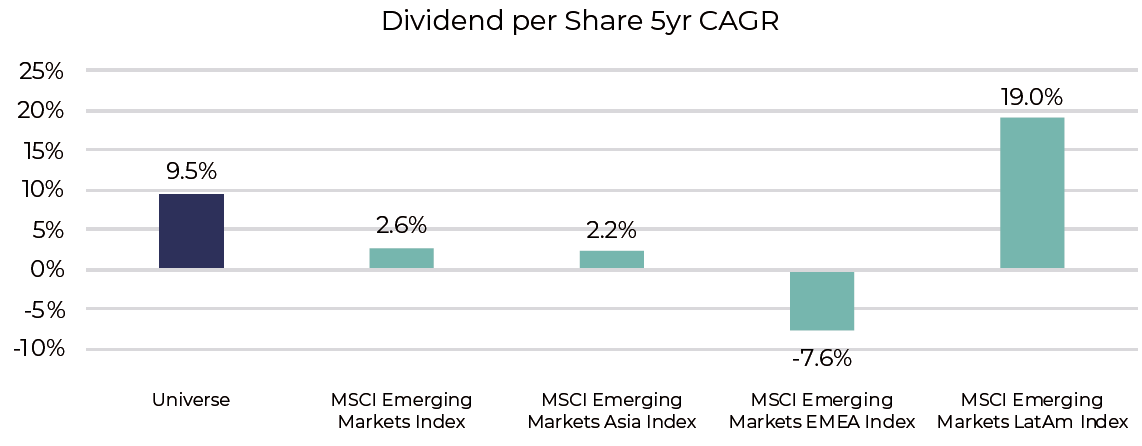
Regional Index is the MSCI Emerging Markets Index and the MSCI Emerging Markets regional indices.
Source: Data from Bloomberg, Universe names from Guinness Global Investors. 31.12.2017 to 31.12.2022
Companies often get into difficulties with the dividend when there is a mismatch between the dividend they have committed to paying (often as a result of history) and their ability to generate the cash to pay the dividend on an ongoing basis. We want to see dividends that represent a genuine return on capital, rather than a return of capital. Management may struggle when the dividend comes to represent more than 100% of earnings (particularly when defined in cash terms). Typically, these companies do not have attractive reinvestment opportunities (and hence are paying out all of their earnings), forcing the shareholder to look elsewhere for avenues for reinvestment.
Moreover, looking at dividend growth in conjunction with dividend cover is often a better indicator of dividend health than merely dividend cover by itself, especially for the types of companies we are looking at. Companies that generate cash and have opportunities to reinvest that cash should be able to achieve growth in profits over time, which provides the underpinning for the dividend.
Dividends play an important role in demonstrating accounting integrity. Because they represent an actual cash payment to shareholders, dividends can act as a useful indicator of underlying cash generation. Over time, we should see a link between growth at the top line, growth at the bottom line, and corresponding growth in dividends. Assuming margins remain constant, and the dividend policy does not change, all three should grow at roughly the same long-term rates, as the following chart shows:
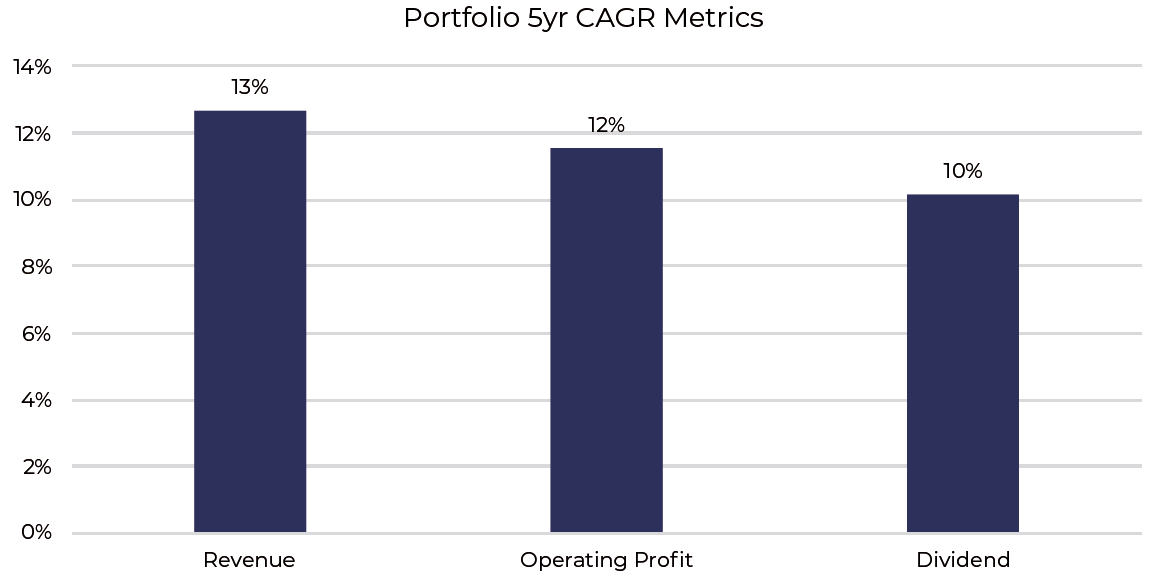
The chart above represents CAGRs for holdings within our portfolio as of 31.12.2022.
Source: Data from Bloomberg, Guinness Global Investors
Dividends and dividend growth are therefore a sign that operating performance is predictable and management have the confidence to reinvest in the growth of the business while also rewarding shareholders.
Returns for Shareholders
So far, we have discussed dividends in terms of company fundamentals – what a company generates in earnings, and what proportion of that is paid out as dividends. The valuation placed by the market on those dividends, the dividend yield, is the subject of this section.
It is important to separate this market element from the fundamental aspects of the company, as both components can drive overall returns to shareholders. While these two areas are interlinked – good fundamental results often generate favourable appraisal by the market – it is important to distinguish them. Focusing solely on the dividend yield conflates the valuation and the operating performance.
In our decomposition of total shareholder return, part of a shareholder’s return can come from valuation rerating, but part comes from earnings and growth of the business over time. We are conscious not to overpay for any given stock, but we generally expect the fundamental returns of the business to dominate overall shareholder returns, particularly over longer periods.
Crucially, for shareholders, it is the process of reinvesting dividends that can have an extraordinary impact on total returns over time. By putting dividends back to work in companies that are growing, those dividends can be further compounded. Over long periods of time, reinvested dividends can account for a substantial portion of overall shareholder returns. The following chart shows the price return of the index and the total return (i.e., with reinvested dividends) over the past 20 years:
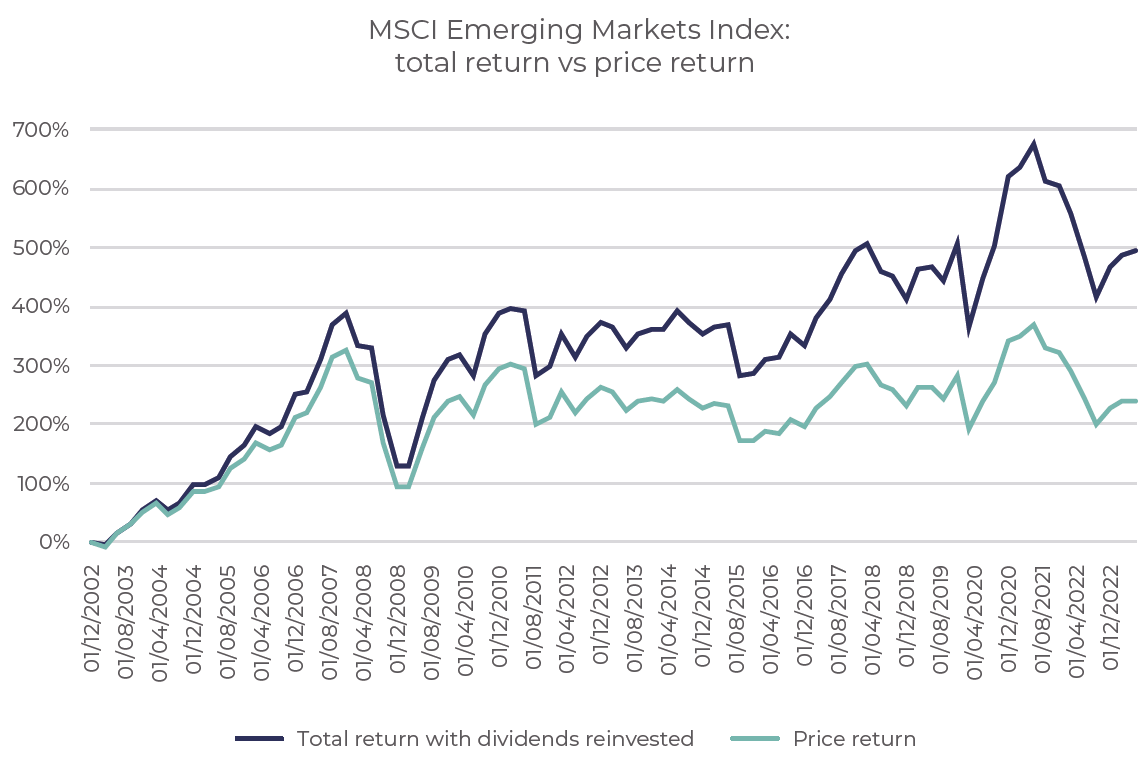
Source: Data from Bloomberg, Guinness Global Investors. Currency is US dollar.
Data 31.12.2002 to 30.06.2023
The effect of the dividend reinvestment is to increase the overall return from 239% to 494% (an increase in the annualised returns from 6.1% to 9.1%).
Returning to dividend yield, our rule of thumb when entering a position is that the stock should yield at least 1.5% (though of course the initial yield can be considerably higher). Assuming we believe a business is undervalued by the market, and that business pays out a substantial dividend (as defined above), then it should be relatively easy to obtain a minimum yield at these levels.
With a dividend payout ratio of around 50% or so, we would expect the initial yield to be around 3.5% to 4%. This would correspond with an earnings yield (the inverse of the P/E ratio) of around 7% to 8%, equivalent to a P/E ratio of 12x to 15x.
(References in this section to yields relate to the investment environment at the time of writing, September 2023. In different market environments, yield levels may vary.)
Portfolio Construction
Once our investment due diligence is completed, we assemble our holdings in a 36-stock portfolio that is typically equally weighted and periodically rebalanced.
With an equally weighted approach, each position equates to 2.75% of the net asset value of the portfolio, with a 1% residual cash position. By rebalancing the positions, we ensure that they are maintained within a band, ensuring that each stock has the potential to contribute meaningfully to performance. We do not have a ‘long tail’ of positions in the portfolio that make only a minimal contribution to overall performance.
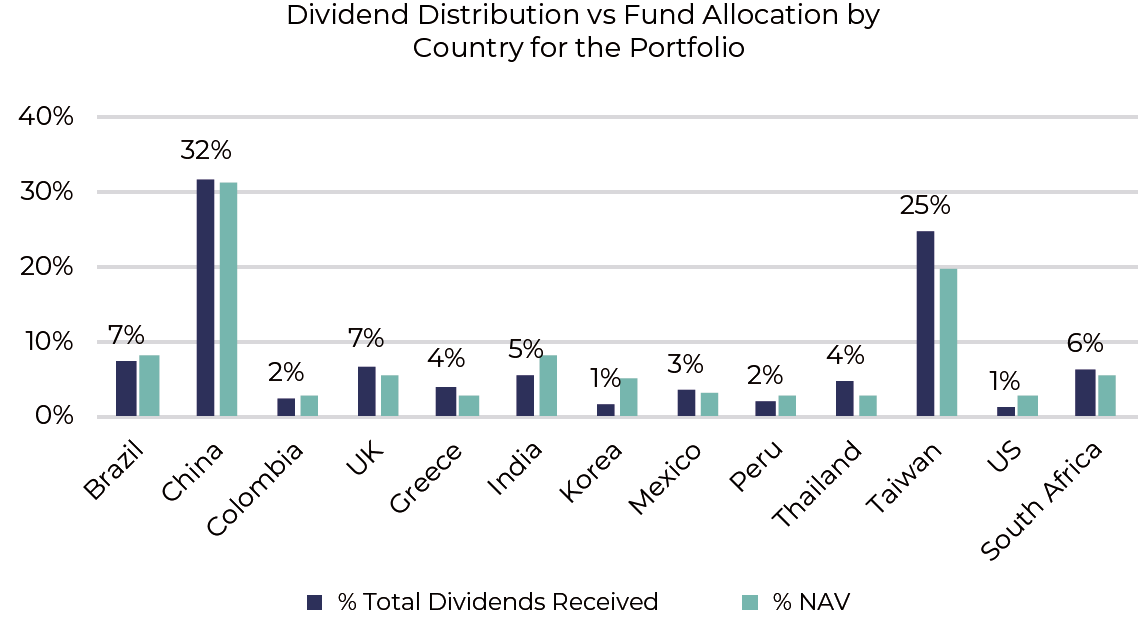
The chart above uses holdings within our portfolio as of 31.12.2022.
Source: Data from Bloomberg, Guinness Global Investors
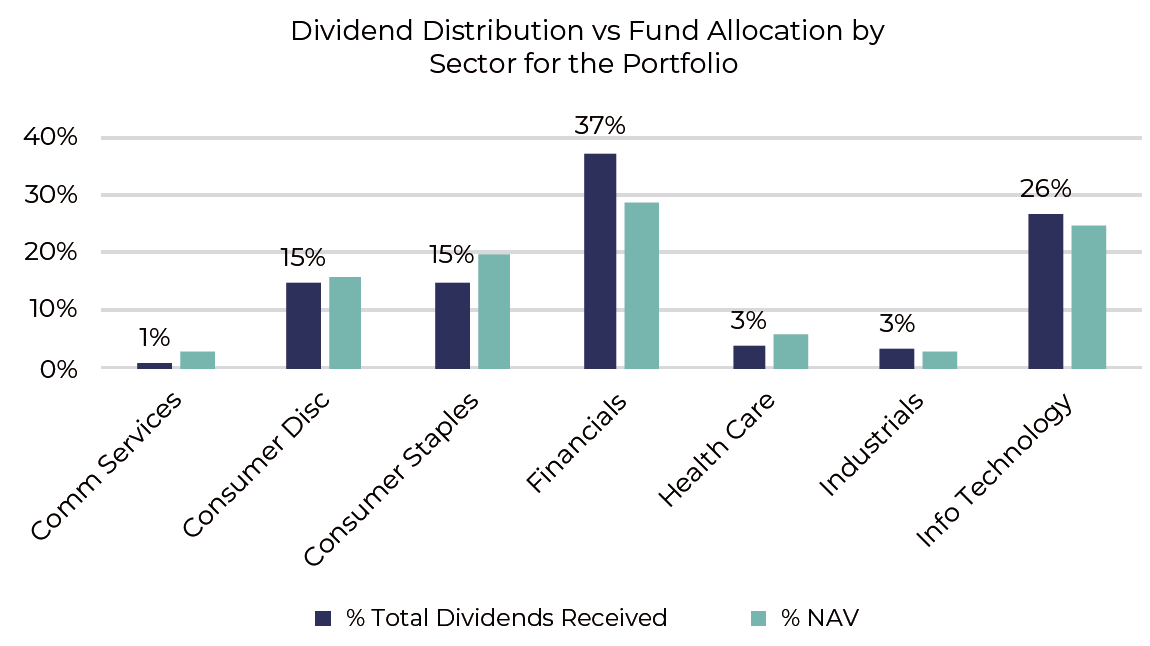
The chart above uses holdings within our portfolio as of 31.12.2022.
Source: Data from Bloomberg, Guinness Global Investors.
As the charts show, the distribution of income closely matches the allocations at the portfolio level. Some sectors or countries have a greater propensity to pay dividends than others; for example, our Taiwan and Thailand stocks contribute a slightly bigger share of overall income than their portfolio weights. Correspondingly, Korea and India contribute less. At the sector level, Financials make a larger relative contribution; Consumer Staples make a smaller one.
Crucially, however, the income distribution across the portfolio is reasonably broad, with each stock in the portfolio contributing. We believe this provides benefits from a diversification perspective. It is also indicative of the discipline with which we run the investment portfolio – the stocks in the portfolio reflect the type of company we are looking for (dividends represent a meaningful part of the capital allocation process; moderate yields with growing dividends over time and so on).
It is illustrative to compare this with what we don’t do. We don’t run a barbell process, with only a portion of the portfolio contributing to the income, sandwiched together with high-growth non-dividend-paying stocks. In an environment of slowing growth, higher inflation, and higher interest rates, we would expect both groups to be more vulnerable to the downside.
EXAMPLE: B3 - BRASIL BOLSA BALCAO
Brasil Bolsa Balcao (B3) is the Brazilian stock exchange and financial services company, located in Sao Paulo. The company also provides clearing and settlement and central depository services.
Its business model is inherently linked to financial cycles and capital markets, but the diverse nature of the wider financial services that it offers offsets this. Financial exchanges typically exhibit favorable company fundamentals, with B3 earning operating margins frequently in excess of 60%.
The following tables show annual sales, operating profit, earnings, and dividends per share achieved by the company and by the regional index since 2010:
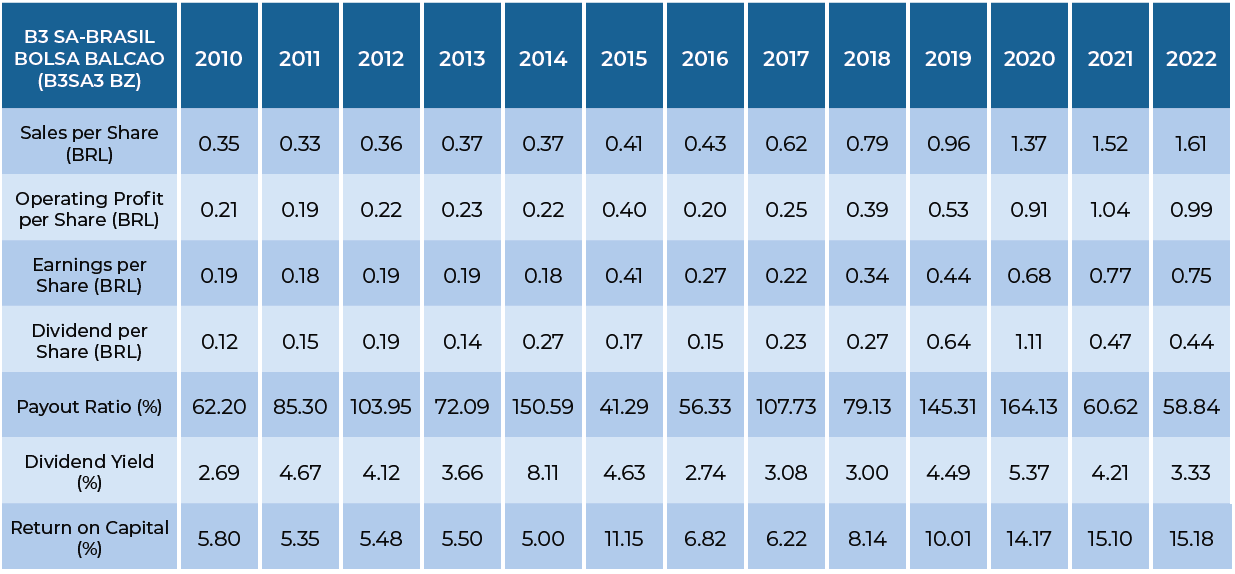
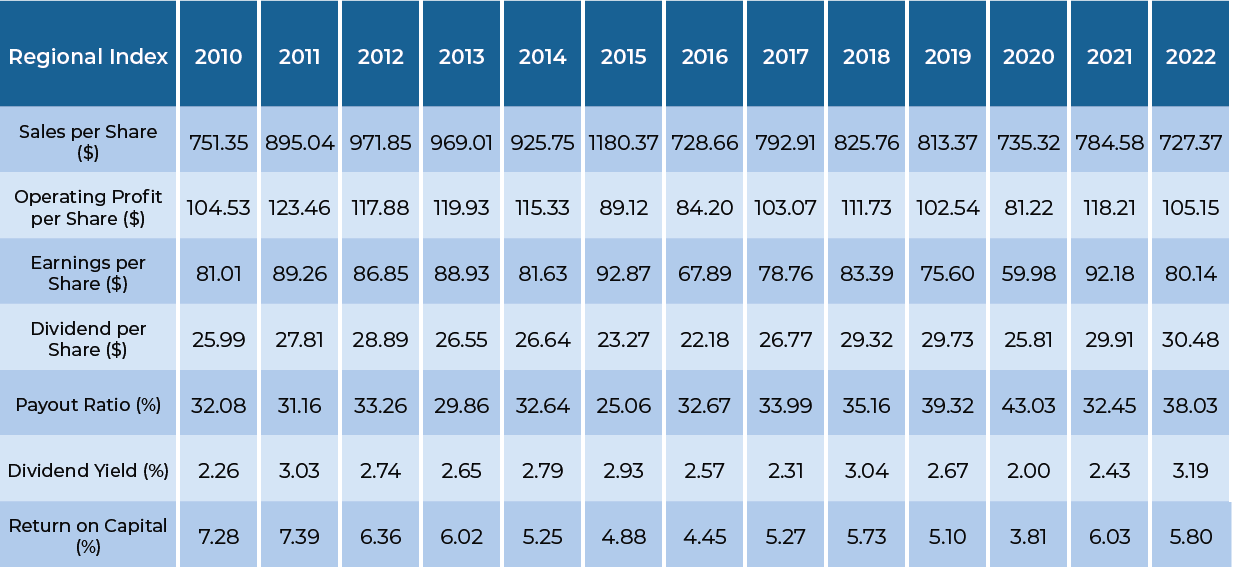
Regional Index is the MSCI Emerging Markets Index.
Source: Data from Bloomberg, Guinness Global Investors. Data as of 31.12.2022
Although the numbers from B3 exhibit year-on-year fluctuation and do not always show consistent growth, the overall CAGR of each line is far superior to that of the regional index, as shown below.
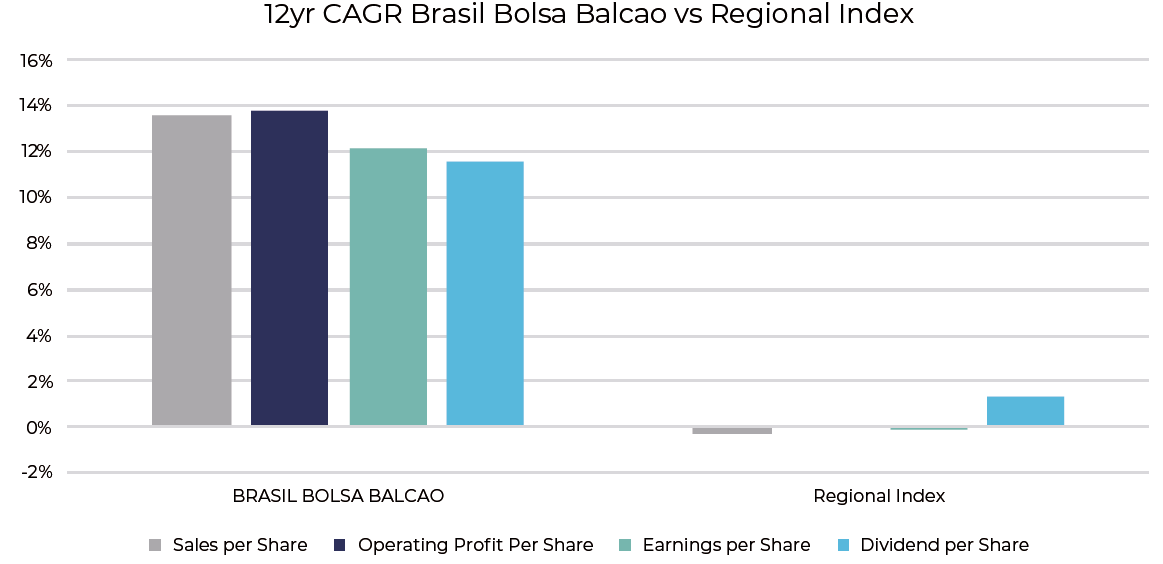
Regional Index is the MSCI Emerging Markets Index.
Source: Data from Bloomberg, Guinness Global Investors. 31.12.2010 to 31.12.2022
Return on capital has fluctuated, but has expanded over time and is now regularly in double digits:
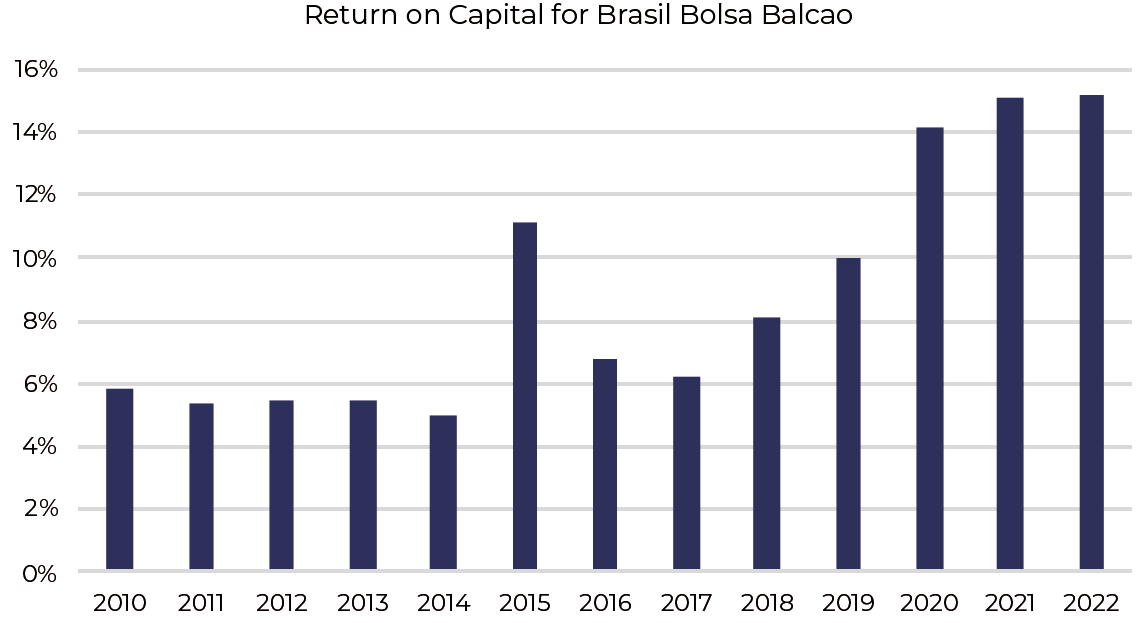
Source: Data from Bloomberg, Guinness Global Investors. 31.12.2010 to 31.12.2022
The company’s payout ratio has varied considerably, and so too have dividends per share, as the following chart illustrates:
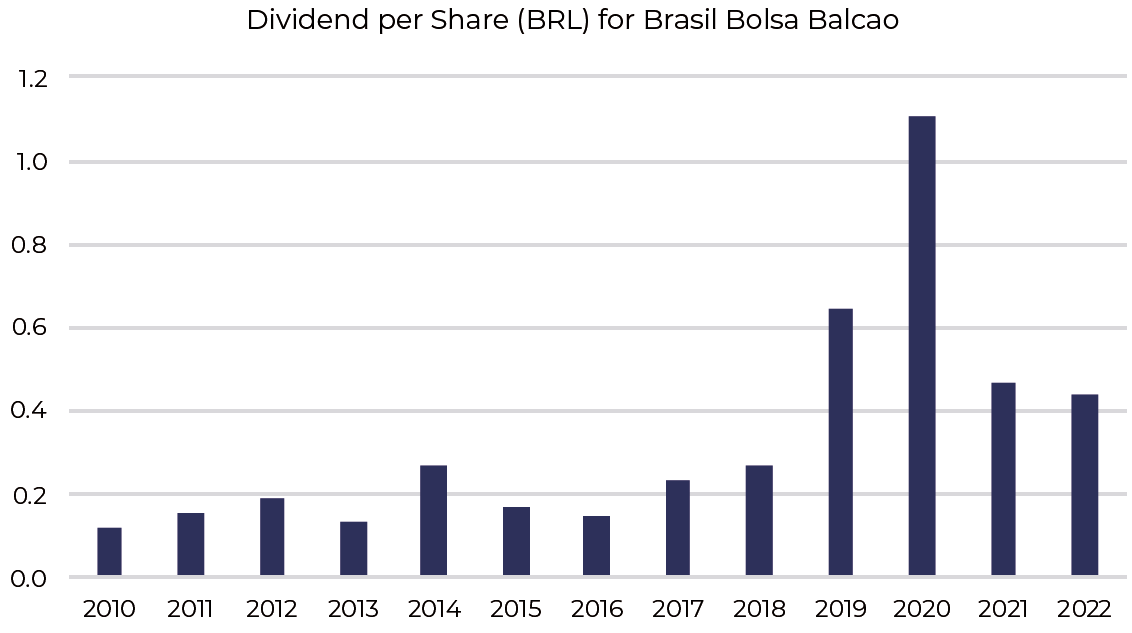
Source: Data from Bloomberg, Guinness Global Investors. 31.12.2010 to 31.12.2022
Dividends have thus been a significant method for returning capital to shareholders, particularly in years where the business has achieved above-average earnings.
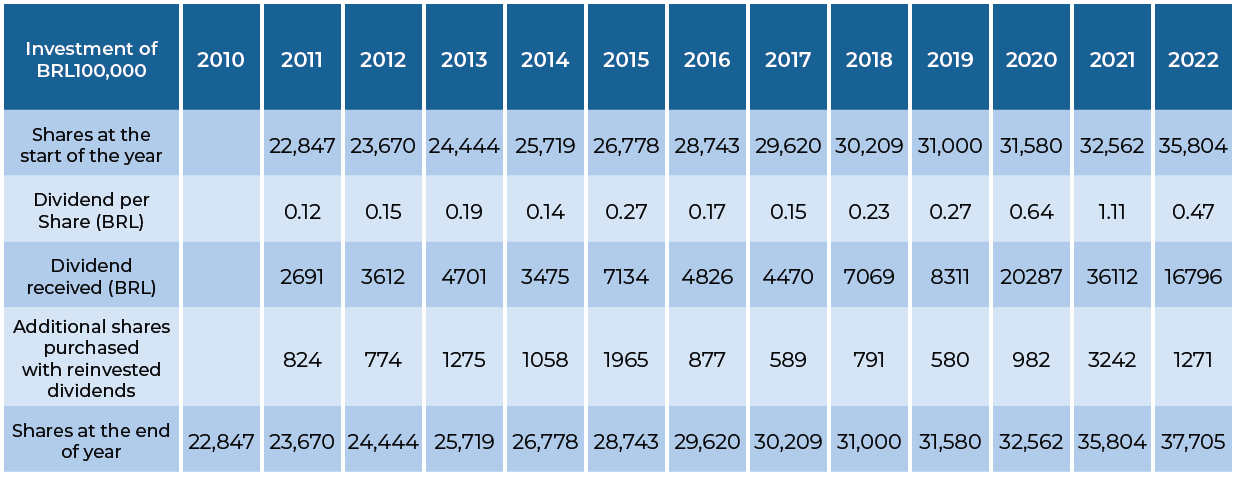
A hypothetical investment of R$100,000 at the end of 2010 would have grown to a figure of R$489,765 by the end of 2022 with dividends reinvested, a compound annual growth rate of approximately 14%. The following table shows that by making regular reinvestments of the dividend income generated, the number of shares held by the investor increases by more than half, from a starting number of 22,847 to reach 37,075.
Source: Bloomberg. Data as of 31.12.2022
(Over the period, the Real depreciated significantly from 1.66 to 5.29 against the dollar, reducing the compound annual growth rate in US dollar terms from around 14% to roughly 4%.)
As we have said before, it is the reinvestment of dividends and their compounding that can produce extraordinary returns over long periods of time.
Risk: The Guinness Emerging Markets Equity Income Fund is an equity fund. Investors should be willing and able to assume the risks of equity investing. The value of an investment and the income from it can fall as well as rise as a result of market and currency movement; you may not get back the amount originally invested. The Funds are actively managed with the MSCI Emerging Markets Index used as a comparator benchmark only.
Further details on the risk factors are included in the Funds' documentation, available on our website (guinnessgi.com/literature)
Disclaimer
This Insight may provide information about Fund portfolios, including recent activity and performance and may contain facts relating to equity markets and our own interpretation. Any investment decision should take account of the subjectivity of the comments contained in the report. This Insight is provided for information only and all the information contained in it is believed to be reliable but may be inaccurate or incomplete; any opinions stated are honestly held at the time of writing but are not guaranteed. The contents of this Insight should not therefore be relied upon. It should not be taken as a recommendation to make an investment in the Funds or to buy or sell individual securities, nor does it constitute an offer for sale.