Asia Dividend Investing


INTRODUCTION
Asia has become a destination for investors seeking income. They don’t, however, have to miss out on the growth that the region offers.
Since the Asia crisis in 1998, the backdrop to investing there has changed. Macro- economic development has continued while Asia has diversified and matured. Headline growth is slower, but transaction velocity, and hence cash flow, has increased with broader individual economic participation. Improved standards of management practice and better corporate behaviour have also helped companies to allocate the cash being generated more effectively.
This approach marries income and growth. It is about identifying companies that translate growth into cash flows in sufficient quantity to fund business growth and to leave a meaningful surplus to distribute to shareholders. A good quality business in these terms is one whose sustained market leadership delivers growing revenue, profit and dividend streams over time.
With the region’s companies generally trading on lower valuations than their developed market peers, Asia is a good hunting ground for income investors. In this paper we explain how we approach the task, structured around five key elements of successful Asia dividend investing: a focus on quality companies; examining the use of cash and capital; ensuring the sustainability of dividends; considering valuation and sources of return; and disciplined portfolio construction. We then look at how these elements have combined in a rewarding real-world stock example.
ASIA DIVIDEND INVESTING
QUALITY MINDSET
A good investment begins with a good company. We use Return on Capital (ROC) as a measure to assess the quality of a business. When assembling our investment universe, we look for companies that have a track record of ROC being consistently higher than the cost of capital.
In the case of the Asian Equity Income strategy, we screen for companies that have returned at least an 8% real return on capital for each of the past eight years. This requirement eliminates approximately 90% of companies from the investment universe.
CAPITAL ALLOCATION & REINVESTMENT FOR GROWTH
How a company uses the cash it is generating and how future capital is allocated becomes a crucial part of our analysis. Our preference is to see a balance between rewarding shareholders with dividends and reinvesting in the business for growth. We find that quality companies in our universe often tend to deliver growth that is both profitable and more consistent than those in the wider universe. By focusing on superior returns on capital, we define an investment universe that sees higher revenue growth, profit growth and dividend growth over time.
DIVIDENDS AS A HEALTH SIGNAL
Dividends can be useful in communicating the condition of the business. Any disruption to the dividend, therefore, provides an important clue that something has gone awry in the underlying process of cash generation. Dividends also play at important role in demonstrating accounting integrity. Over time, we should see a link between growth at the top line, growth at the bottom line, and corresponding growth in dividends.
RETURNS FOR SHAREHOLDERS
Part of a shareholder’s return can come from valuation rerating, but part should come from earnings and growth of the business. We are conscious not to overpay for any given stock, but we generally expect the fundamental returns of the business to dominate overall shareholder returns, particularly over the medium to long term. For shareholders, the process of reinvesting dividends can have an extraordinary impact on total returns. By putting dividends back to work in companies that are growing, those dividends can be further compounded. Over long periods of time, reinvested dividends can account for a substantial portion of overall shareholder returns.
PORTFOLIO CONSTRUCTION
Our portfolio of 36 broadly equally weighted stocks ensures that all positions have the potential to contribute meaningfully to performance. We operate the portfolio on a ‘one in, one out’ basis.
The income distribution across the portfolio is diversified and reasonably broad, with each stock in the portfolio making a contribution. We don’t operate a barbell process, whereby only a portion of the portfolio contributes to income and the remainder is invested in non-dividend paying growth stocks.
QUALITY MINDSET
A good investment begins with a good company. High-quality businesses exhibit characteristics such as competitive advantages, whether they are in the form of unique products, efficient cost structures, superior management, or intellectual property, based on a sound financial platform.
We use Return on Capital (ROC) to assess the quality of a business and look for companies that have a track record of ROC being consistently higher than the cost of capital. This approach focuses on creating wealth that is capable of supporting future expansion and generating growing cash flows for shareholders.
In the case of the Asian Equity Income strategy, we look for companies that have returned at least an 8% real return on capital for each of the past eight years. This requirement eliminates approximately 90% of companies from the investment universe, and specifically those with the following features:
- Negative or mediocre returns
- Excessively cyclical returns
- An insufficient track record
We then add two further criteria to our screening process. A company’s market capitalization must be at least $500 million to make it easy enough to invest in, and it must not be overly indebted. This narrows our investible universe to around 600 companies with an average ‘real’ ROC of c.9.5% since 2010.
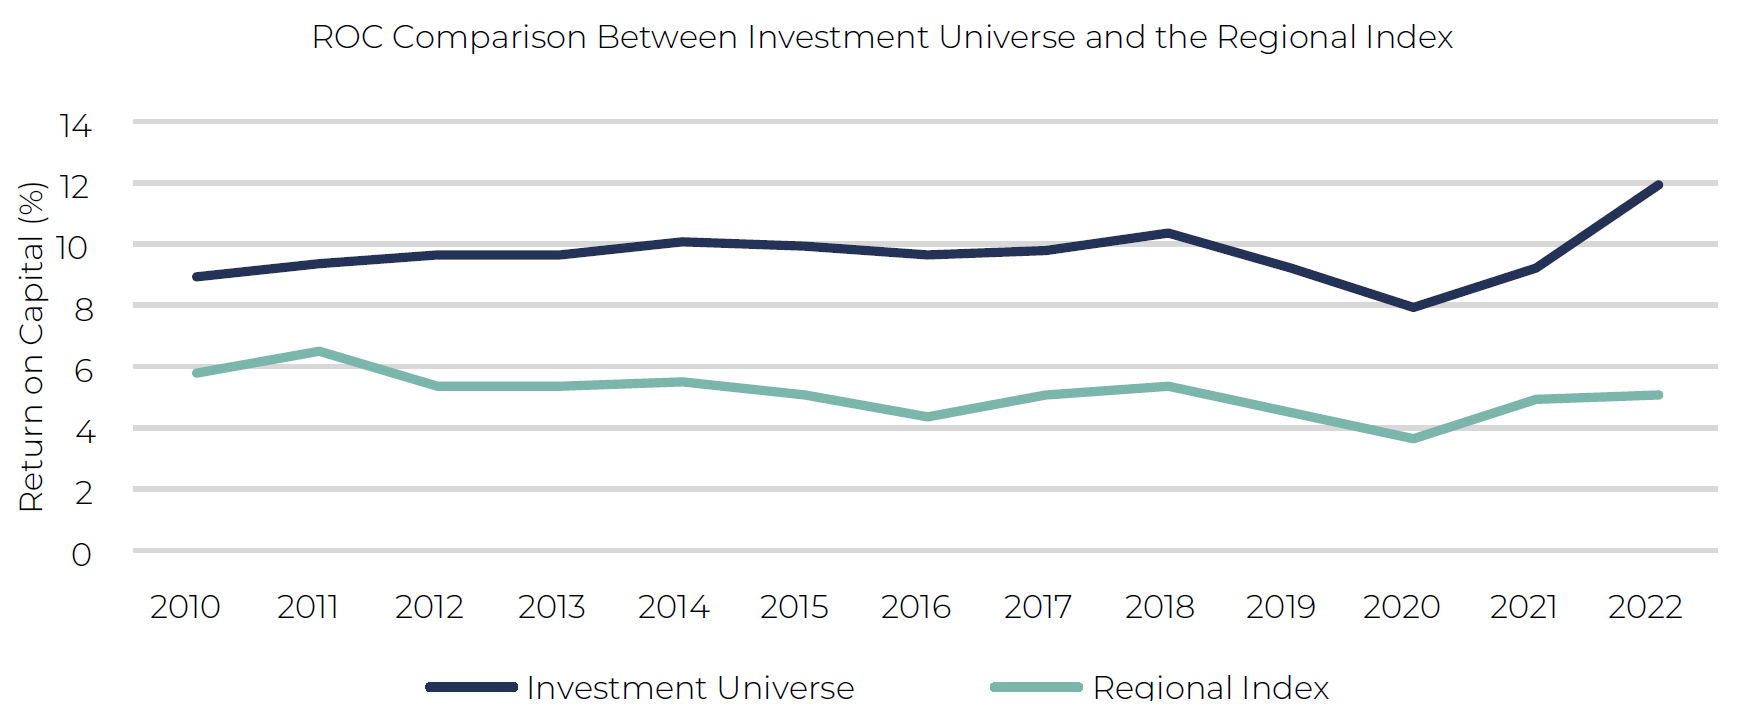
Regional Index is the MSCI AC Asia Pacific ex Japan Index. Source: Data from Bloomberg, Universe names from Guinness Global Investors. 31.12.2010 to 31.12.2022
CAPITAL ALLOCATION & REINVESTMENT FOR GROWTH
Companies that earn high rates of returns have the welcome problem of what to do with the cash. How that capital is used and how future capital is allocated forms a crucial part of our analysis.
Companies that have earnt high returns on capital demonstrate that management have allocated capital judiciously. Such companies often have attractive opportunities to reinvest in projects with high returns that exceed the cost of capital.
The importance of a company reinvesting in the business cannot be understated. Over long periods of time, it is the reinvestment of profits that drives future growth in the business. The growing capital base of the business supports growth in the top line, and feeds into a growing earnings stream and (assuming a stable dividend policy) a growing dividend stream.
When faced with decisions about which projects to reinvest in, management should, in our view, stick to what they know well. If a company has earnt high returns in the past, the probability that they will do so in future is much higher if it does not attempt to move into a very different line of business from its current operations. Large scale M&A, so called ‘transformative’ acquisitions, can work, but these tend to be the exception. Too often the transformation is a detrimental one. Similarly, management should be careful not to overpay, resulting in poor future returns on the capital invested.
Our preference is to see a balance between rewarding shareholders with dividends and reinvesting in the business for growth. We find that our universe of quality companies often tends to deliver growth that is both profitable and more consistent than found in the wider universe. Indeed, companies with the highest level of expected growth often disappoint when it comes to realising this growth later.
Crucially, when paired with our focus on superior returns on capital, we end up with a universe which over time sees higher revenue growth, profit growth and dividend growth.
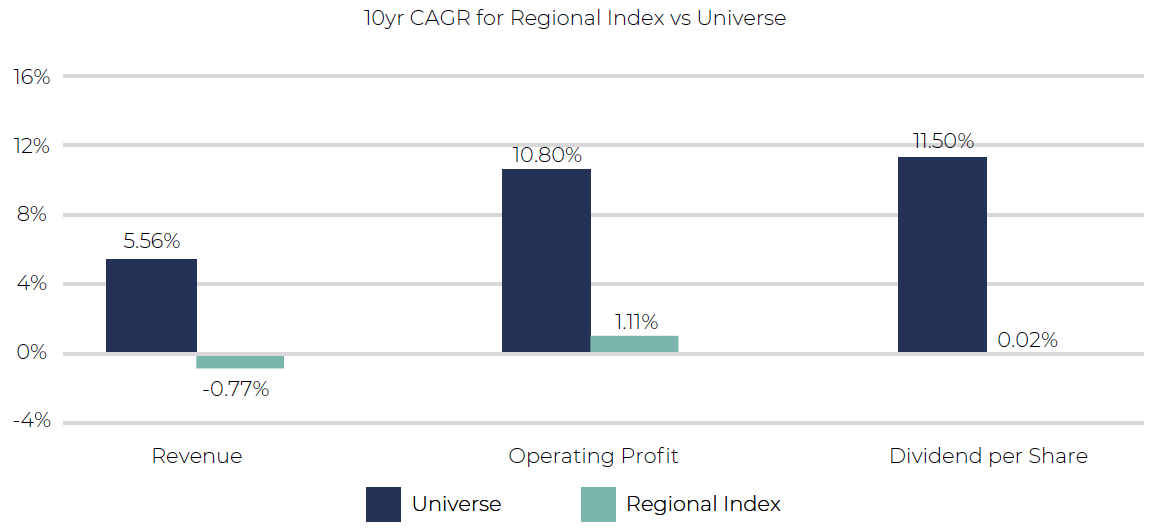
Regional Index is the MSCI AC Asia Pacific ex Japan Index. CAGR: compound annual growth rate. Source: Data from Bloomberg, Universe names from Guinness Global Investors. 31.12.2012 to 31.12.2022
If we look at the region, we can see individual countries differ in their balance between payout ratio and growth:
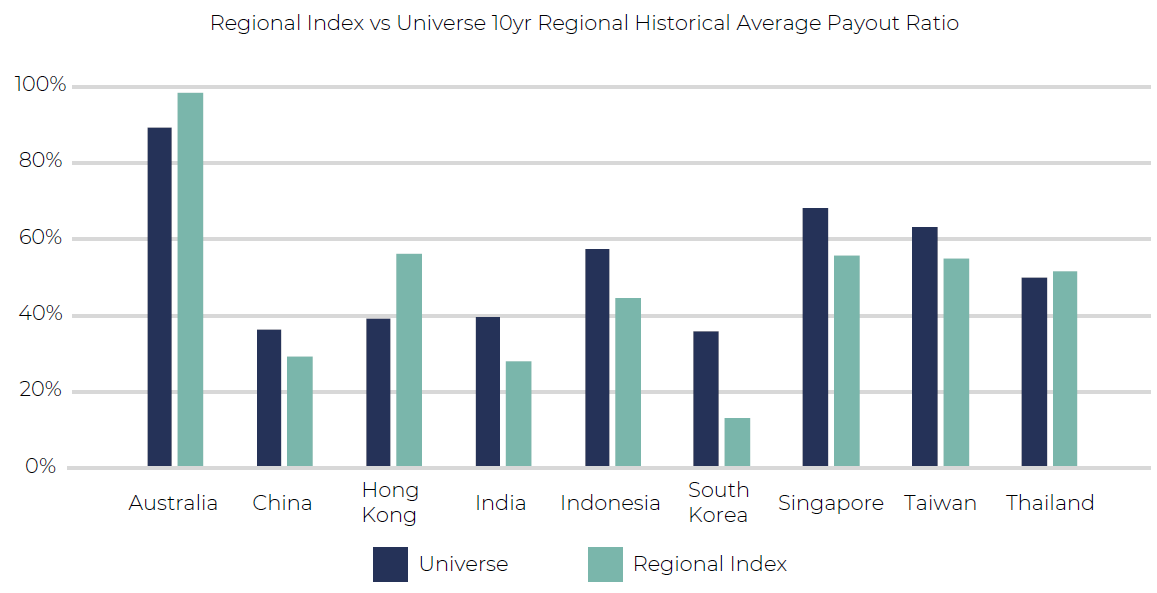
Regional Index uses data from the corresponding MSCI country index. Source: Data from Bloomberg, Universe names from Guinness Global Investors. 31.12.2012 to 31.12.2022
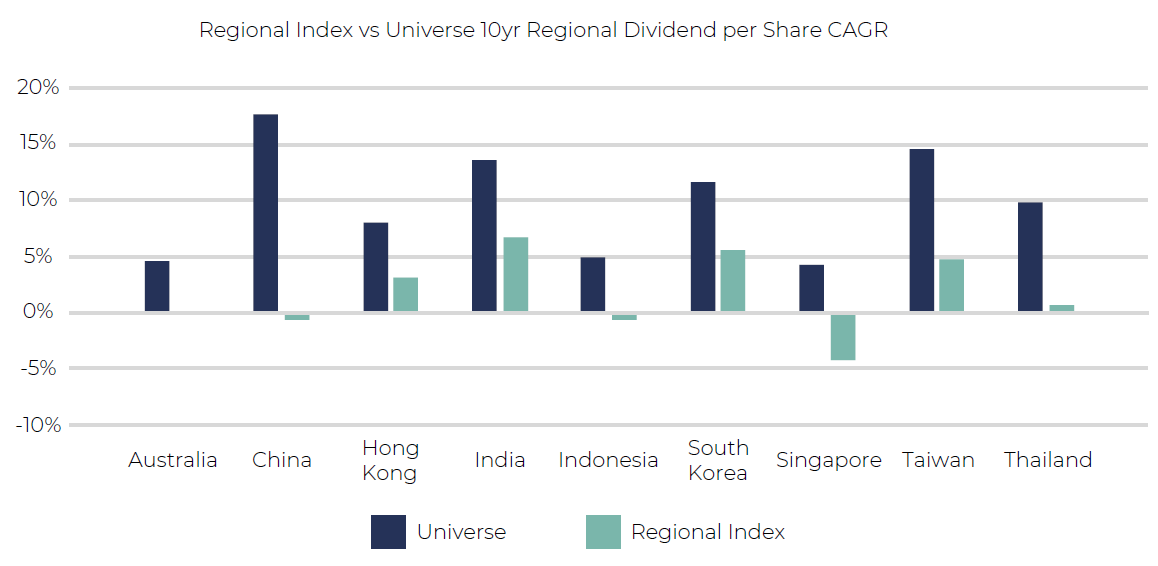
Regional Index uses data from the corresponding MSCI country index. Source: Data from Bloomberg, Universe names from Guinness Global Investors. 31.12.2012 to 31.12.2022
While Australia is a big contributor to dividend payments, dividend growth has tended to be lower. Emerging Asia (particularly China and India) has seen faster dividend growth, though lower payout ratios. Taiwan has remained an outlier with both higher payout ratio and higher dividend growth.
However, if we look at the universe as a whole, we see that this subset of companies has achieved higher dividend growth than the regional index, despite a higher payout ratio:
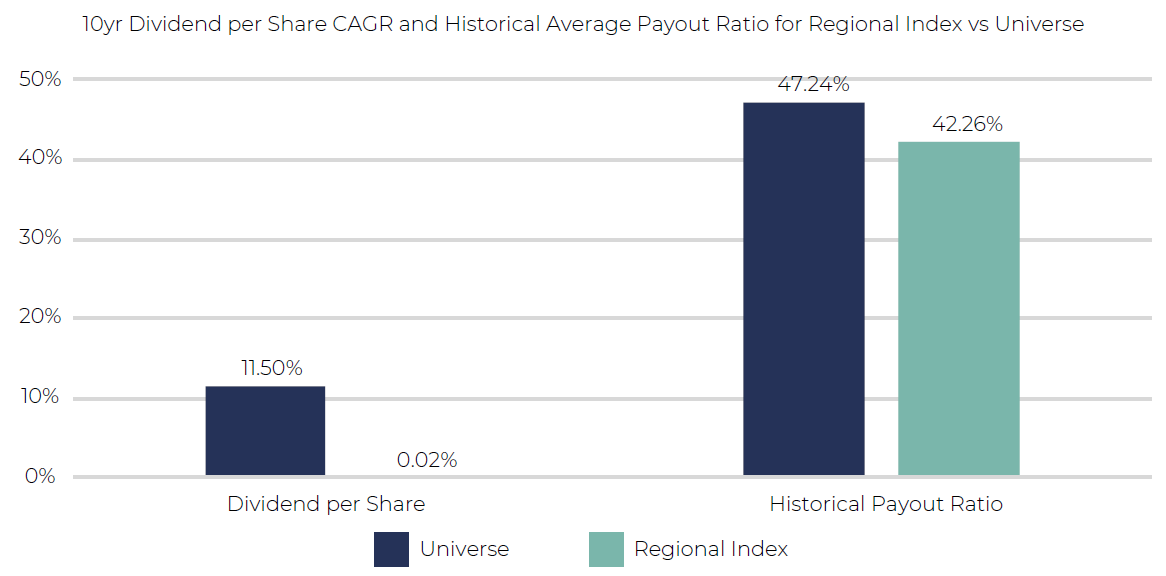
Regional Index is the MSCI AC Asia Pacific ex Japan Index. Source: Data from Bloomberg, Universe names from Guinness Global Investors. 31.12.2012 to 31.12.2022
Generally, we have found a payout ratio of around 50% to be about the right level for the portfolio overall.
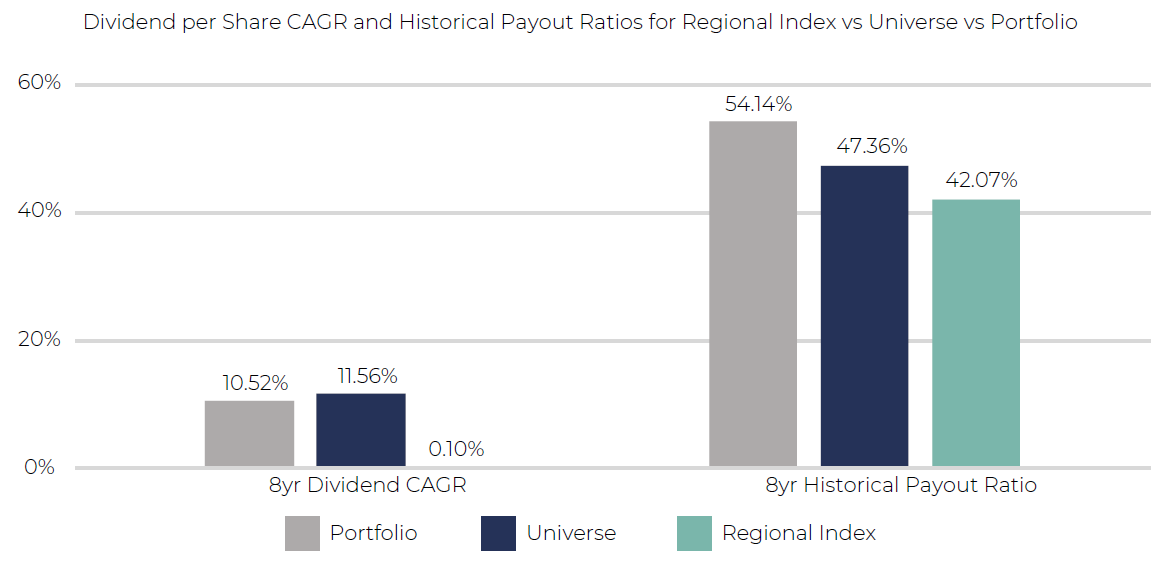
Regional Index is the MSCI AC Asia Pacific ex Japan Index. Source: Data from Bloomberg, Portfolio and Universe names from Guinness Global Investors. 31.12.2014 to 31.12.2022
DIVIDENDS AS A HEALTH SIGNAL
Dividends play an important role in signalling the underlying health of the business. We believe the businesses we are investing in – companies with attractive returns on capital in cash-based terms – should be able to return some of their cash to shareholders. Any disruption to this dividend, therefore, provides an important clue that something has gone awry in this underlying process of cash generation. As such, we view dividend growth to be the ultimate mark of success, and we can see how the universe companies have grown dividends over time:
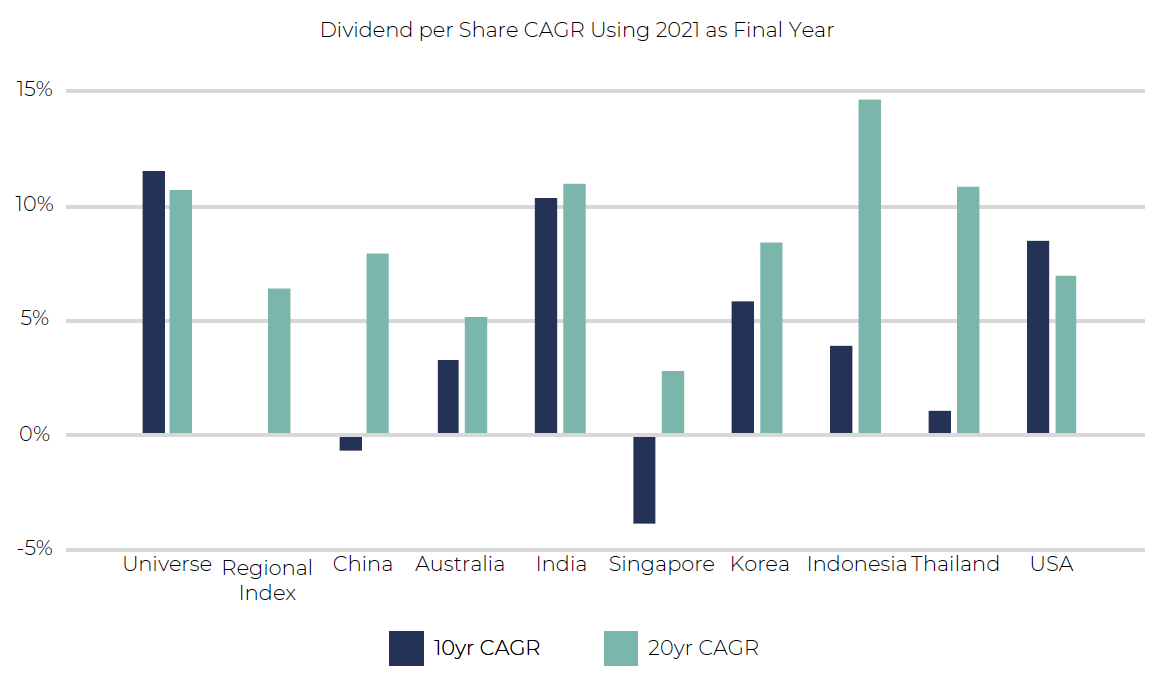
Regional Index is the MSCI AC Asia Pacific ex Japan Index. Country data comes from the corresponding MSCI country index, e.g. China uses MSCI China Index data. Source: Data from Bloomberg, Universe names from Guinness Global Investors. 31.12.2001 to 31.12.2021
Companies often get into difficulties with the dividend when there is a mismatch between the dividend they have committed to paying (often as a result of history) and their ability to generate the cash to pay the dividend on an ongoing basis. We want to see dividends that represent a genuine return on capital, rather than a return of capital. Management may struggle when the dividend comes to represent more than 100% of earnings (particularly when defined in cash terms). Typically, these companies do not have attractive reinvestment opportunities (and hence are paying out all of their earnings), forcing the shareholder to look elsewhere for avenues for reinvestment.
Moreover, looking at dividend growth in conjunction with dividend cover is often a better indicator of dividend health than merely dividend cover by itself, especially for the types of companies we are looking at. Companies that generate cash and have opportunities to reinvest that cash should be able to achieve growth in profits over time, which provides the underpinning for the dividend.
Dividends play at important role in demonstrating accounting integrity. Because they represent an actual cash payment to shareholders, dividends can act as a useful indicator of underlying cash generation. Over time, we should see a link between growth at the top line, growth at the bottom line, and corresponding growth in dividends. Assuming margins remain constant, and the dividend policy does not change, all three should grow at roughly the same long-term rates, as the following chart shows:
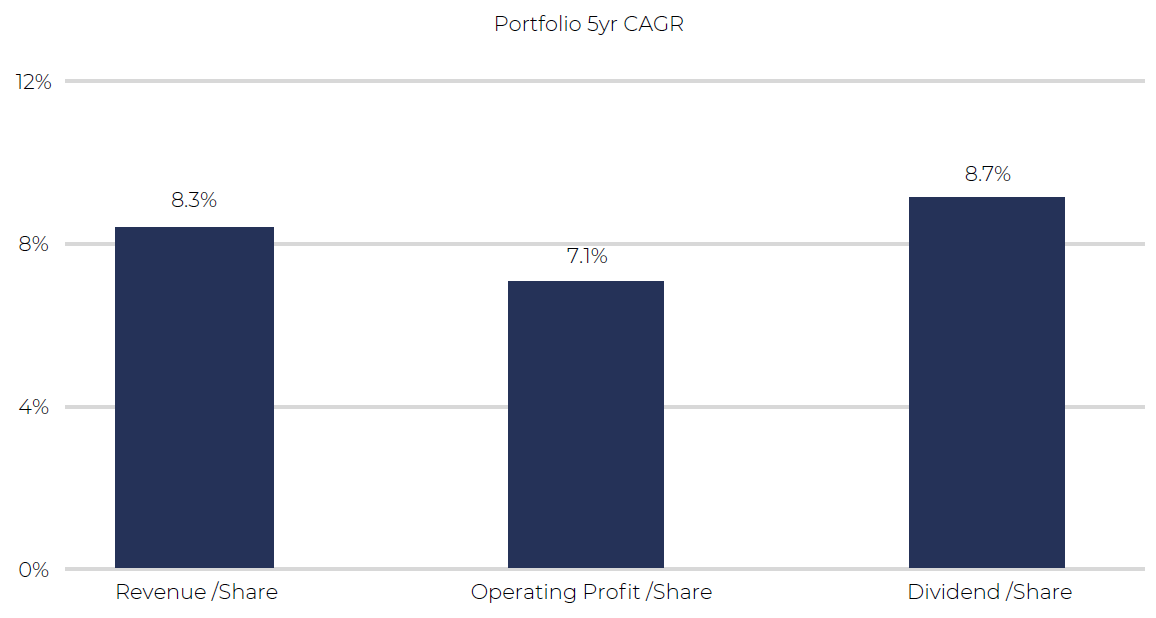
The chart above represents CAGRs for holdings within our portfolio as of 31.12.2021. Source: Data from Bloomberg, Guinness Global Investors
Dividends and dividend growth are therefore a sign that operating performance is predictable and management have the confidence to reinvest in the growth of the business while also rewarding shareholders.
RETURNS FOR SHAREHOLDERS
So far, we have discussed dividends in terms company fundamentals – what a company generates in earnings, and what proportion of that is paid out as dividends. The valuation placed by the market on those dividends, the dividend yield, is the subject of this section.
It is important to separate this market element from the fundamental aspects of the company, as both components can drive overall returns to shareholders. While these two areas are interlinked – good fundamental results often generate favourable appraisal by the market – it is important to distinguish them. Focusing solely on the dividend yield conflates the valuation and the operating performance.
In our decomposition of total shareholder return, part of a shareholder’s return can come from valuation rerating, but part comes from earnings and growth of the business over time. We are conscious not to overpay for any given stock, but we generally expect the fundamental returns of the business to dominate overall shareholder returns, particularly over longer periods.
Crucially, for shareholders it is the process of reinvesting dividends that can have an extraordinary impact on total returns over time. By putting dividends back to work in companies that are growing, those dividends can be further compounded. Over long periods of time, reinvested dividends can account for a substantial portion of overall shareholder returns. The following chart shows the price return of the index and the total return (i.e. with reinvested dividends) over the past 20 years:
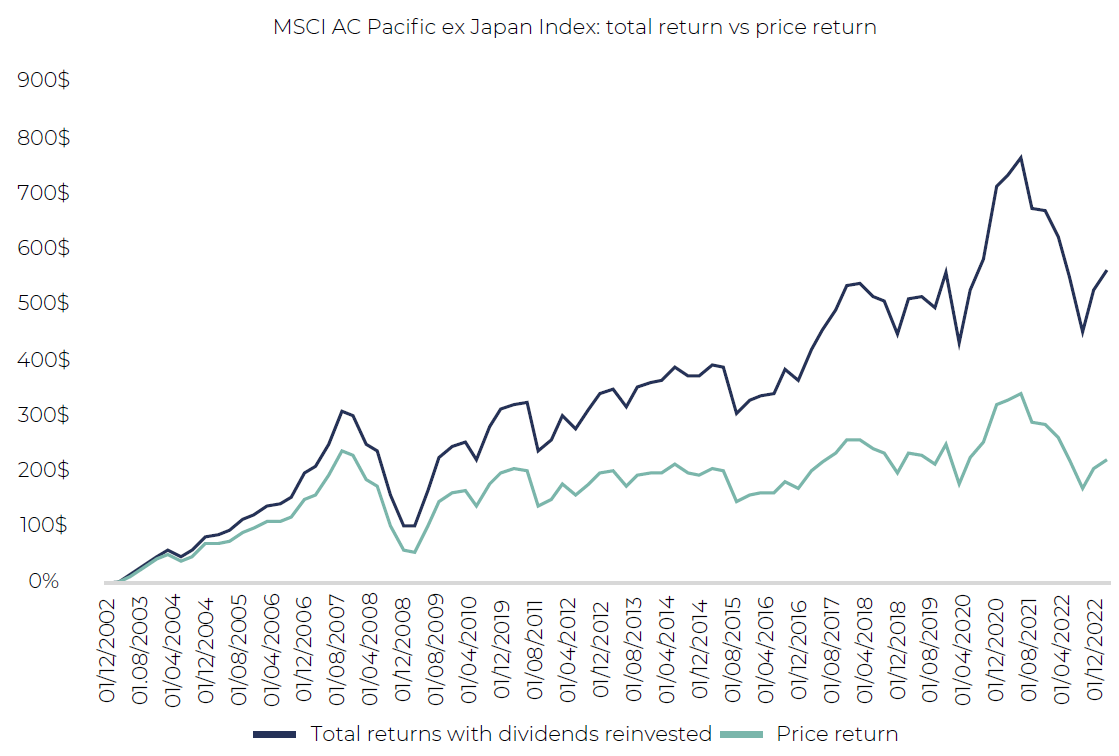
Source: Data from Bloomberg, Guinness Global Investors. Currency is US dollar. Data 31.03.2003 to 31.03.2023
The effect of the dividend reinvestment is to increase the overall return from 220% to 563% (an increase in the annualised returns from 5.9% to 9.8%).
Returning to dividend yield, our rule of thumb when entering a position is that the stock should yield at least 1.5% to 2% (though of course the initial yield can be considerably higher). Assuming we believe a business is undervalued by the market, and that business pays out a substantial dividend (as defined above), then it should be relatively easy to obtain a minimum yield at these levels.
With a dividend payout ratio of around 50% or so, we would expect the initial yield to be around 3.5% to 4%. This would correspond with an earnings yield (the inverse of the P/E ratio) of around 7% to 8%, equivalent to a P/E ratio of 12x to 15x.
(References in this section to yields relate to the investment environment at time of writing, February 2023. In different market environments, yield levels may vary.
PORTFOLIO CONSTRUCTION
Once our investment due diligence is completed, we assemble our holdings in a 36-stock portfolio with equal target weights and periodic rebalancing.
With 36 stocks, the target weight for each is 2.75% of the net asset value of the portfolio, with a 1% residual cash position. By rebalancing the positions, we ensure that they are maintained within a band, ensuring that each stock has the potential to contribute meaningfully to performance. We do not have a ‘long tail’ of positions in the portfolio that make only a minimal contribution to overall performance.
Crucially, the number of positions is fixed, meaning that in order to add a new stock into the portfolio, one must first be sold. This requirement, in conjunction with the portfolio concentration, means that the portfolio contains only our highest-conviction ideas. Moreover, the majority of our efforts can be devoted to stock selection rather than position sizing.
Taking the income received in the Guinness Asian Equity Income portfolio over the course of 2022, we can perform an attribution analysis to determine its source by country and sector:
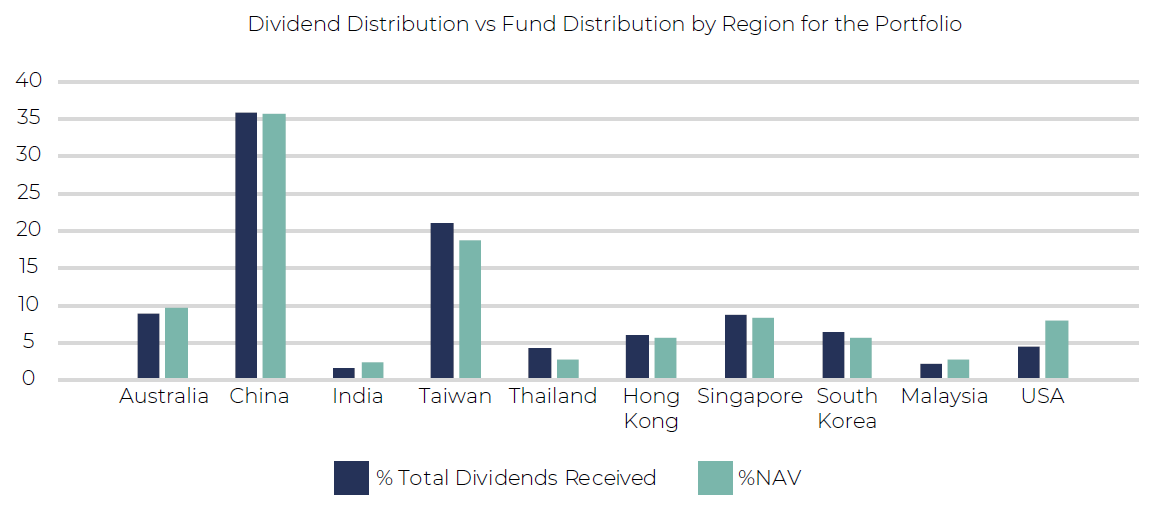
The chart above uses holdings within our portfolio as of 31.12.2022. Source: Data from Bloomberg, Guinness Global Investors
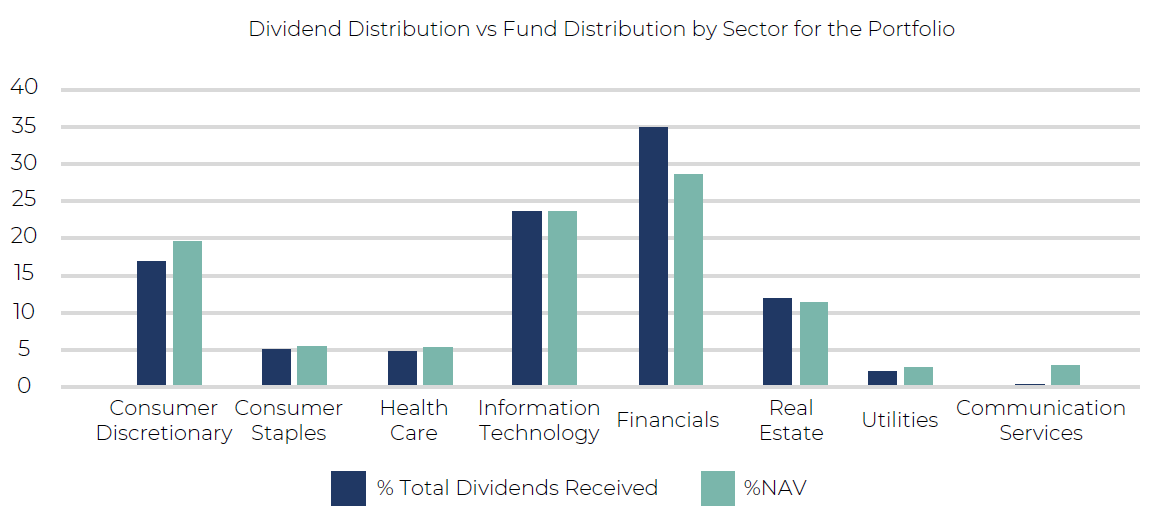
The chart above uses holdings within our portfolio as of 31.12.2022. Source: Data from Bloomberg, Guinness Global Investors.
As the charts show, the distribution of income closely matches the allocations at the portfolio level. Some sectors or countries have a greater propensity to pay dividends than others; for example, our Taiwan and Hong Kong stocks contribute a slightly bigger share of overall income than their portfolio weights. Correspondingly, Australia and China contribute slightly less. At the sector level, Financials makes a larger relative contribution; Consumer Discretionary makes a smaller one.
Crucially, however, the income distribution across the portfolio is reasonably broad, with each stock in the portfolio contributing. We believe this provides benefits from a diversification perspective. It is also indicative of the discipline with which we run the investment portfolio – the stocks in the portfolio reflect the type of company we are looking for (dividends represent a meaningful part of the capital allocation process; moderate yields with growing dividends over time and so on).
It is illustrative to compare this with what we don’t do. We don’t run a barbell process, with only a portion of the portfolio contributing to the income, sandwiched together with high-growth non-dividend paying stocks. In an environment of slowing growth, higher inflation and higher interest rates, we would expect both groups to more vulnerable to the downside.
EXAMPLE: ELITE MATERIAL
Elite Material is a manufacturer of PCB materials, which are used in various end devices including consumer electronics, automotive applications and computer infrastructure. The company is the word leader in halogen-free laminates, and this niche has been highly profitable for Elite.
The following tables shows annual sales, operating profit, earnings and dividends per share achieved by the company and by the regional index since 2010:
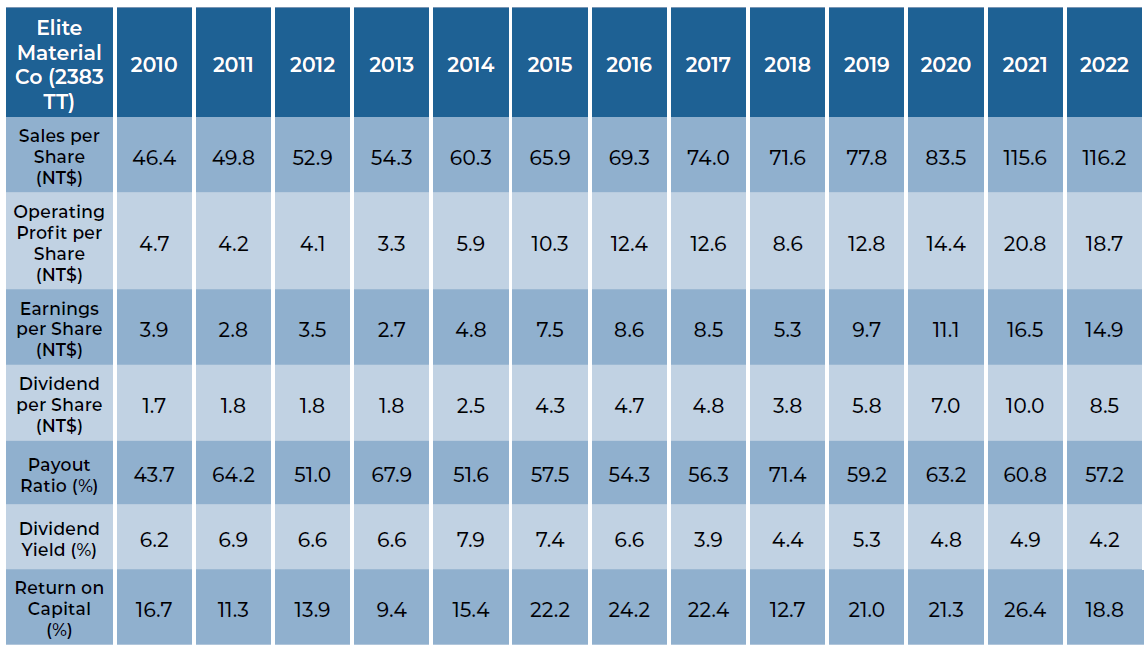
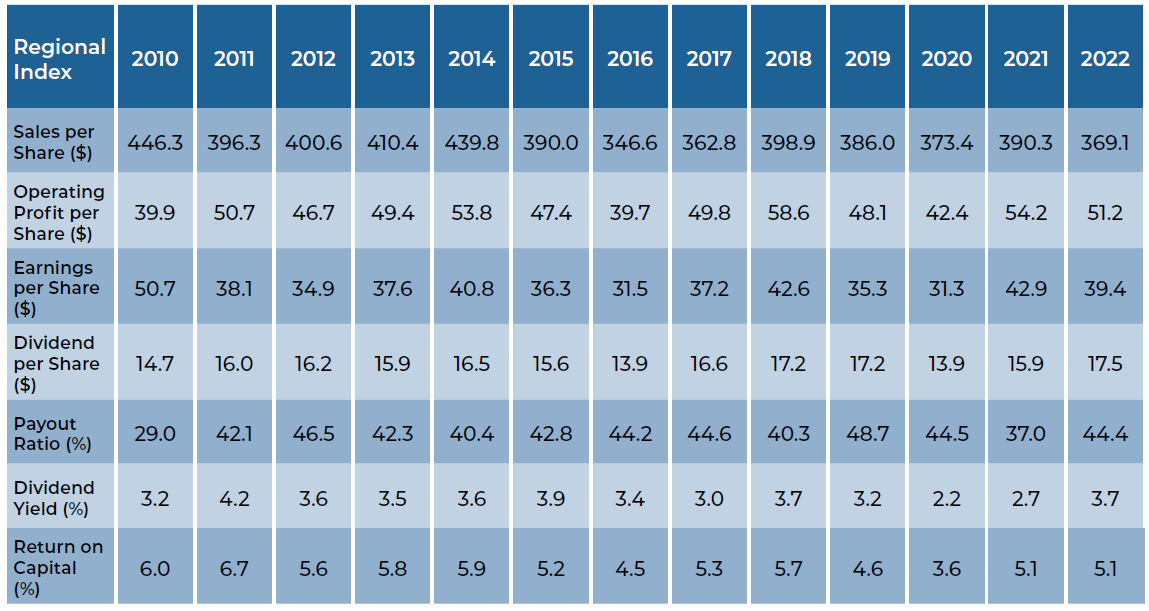
Regional Index is the MSCI AC Asia Pacific ex Japan Index. Source: Data from Bloomberg, Guinness Global Investors. Data as of 31.12.2022
Although the numbers from Elite Material fluctuate year-on-year and do not show a constant upwards trajectory, the overall CAGR of each line is actually superior to that of the regional index, as shown below.
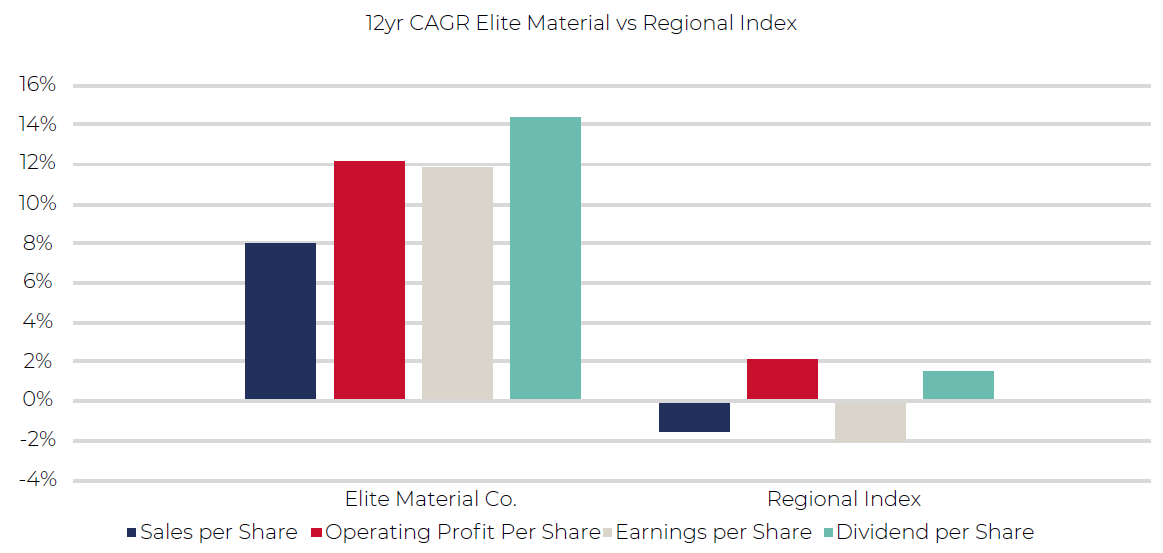
Regional Index is the MSCI AC Asia Pacific ex Japan Index.Source: Data from Bloomberg, Guinness Global Investors. 31.12.2010 to 31.12.2022
Return on capital has fluctuated, but has typically been above 10%, and in recent years has often exceeded 20%:
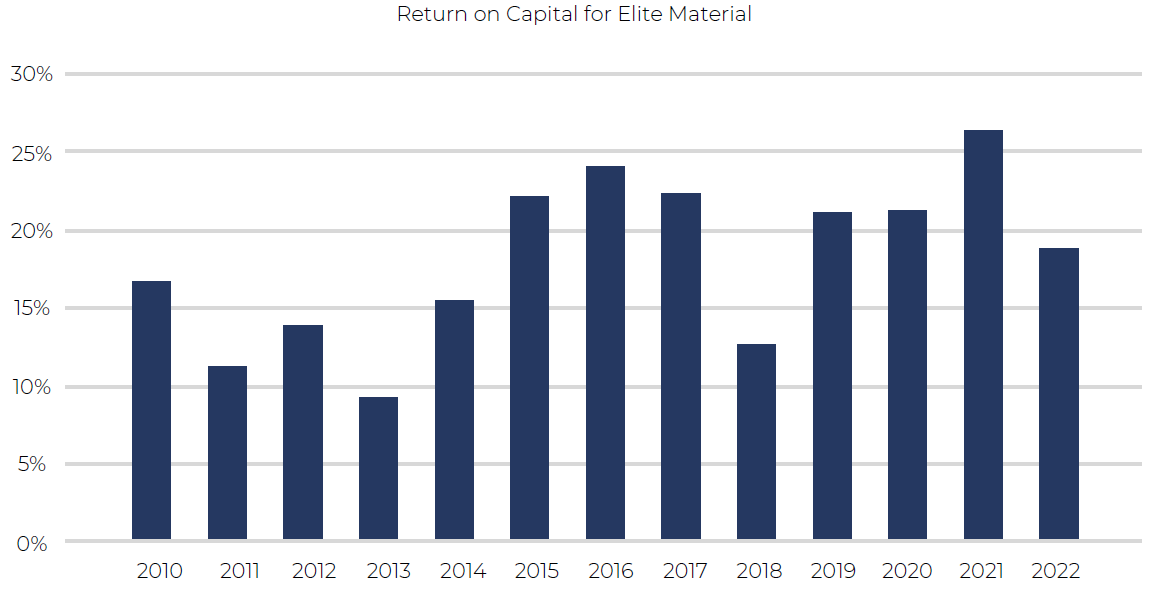
Source: Data from Bloomberg, Guinness Global Investors. 31.12.2010 to 31.12.2022
The company’s payout ratio has varied between 44% and 71%, but the overall result has been growth in the dividend, as the following chart showing dividends per share (DPS) illustrates:
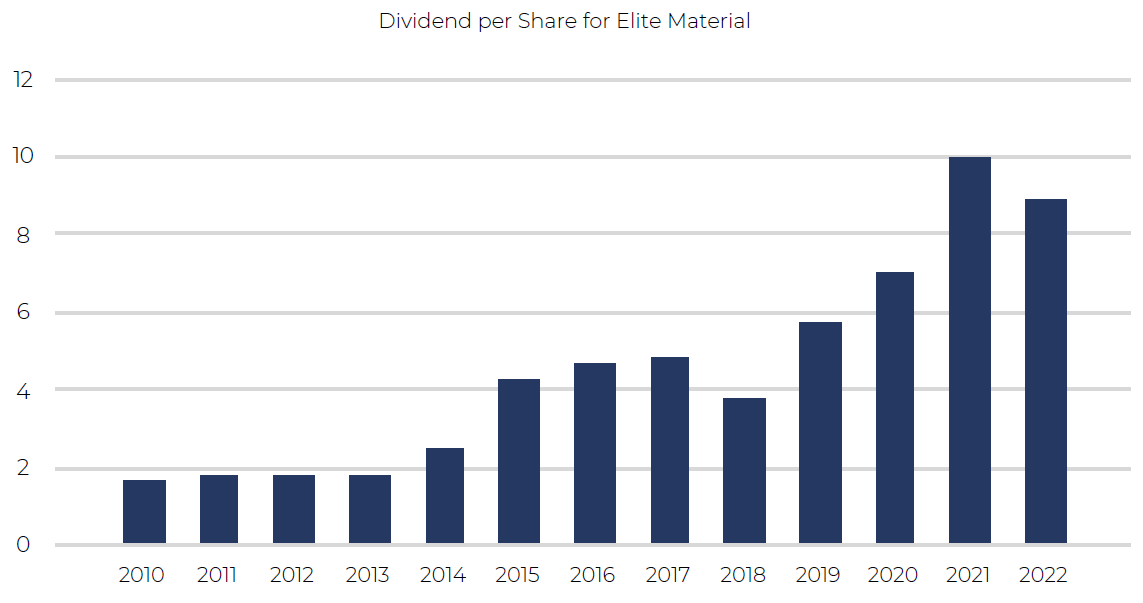
Source: Data from Bloomberg, Guinness Global Investors. 31.12.2010 to 31.12.2022
A hypothetical investment of $10,000 at the end of 2010 would have grown to a figure of $82,000 by the end of 2022 with dividends reinvested. The following table shows that by making regular reinvestments of the dividend income generated, the number of shares held by the investor almost doubles from a starting number of 9,731 to reach 17,597:
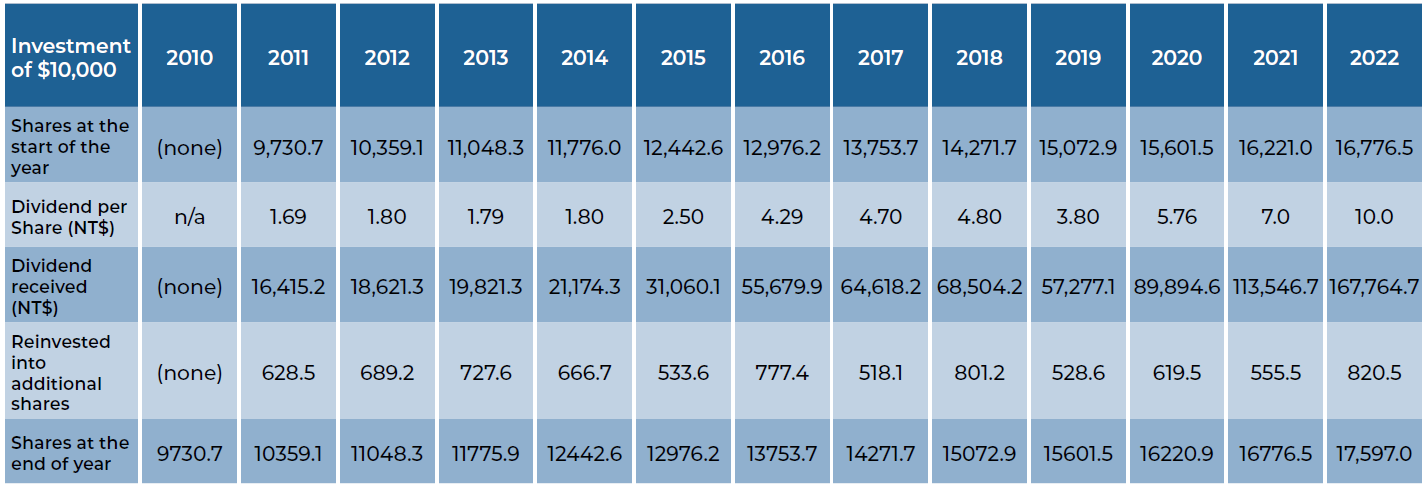
Source: Bloomberg. Data as of 31.12.2022
As we have said before, it is the reinvestment of dividends and their compounding that can produce extraordinary returns over long periods of time.
Disclaimer: This Insight may provide information about Fund portfolios, including recent activity and performance and may contains facts relating to equity markets and our own interpretation. Any investment decision should take account of the subjectivity of the comments contained in the report. This Insight is provided for information only and all the information contained in it is believed to be reliable but may be inaccurate or incomplete; any opinions stated are honestly held at the time of writing but are not guaranteed. The contents of this Insight should not therefore be relied upon. It should not be taken as a recommendation to make an investment in the Funds or to buy or sell individual securities, nor does it constitute an offer for sale.
Companies that have earnt high returns on capital demonstrate that management have allocated capital judiciously. Such companies often have attractive opportunities to reinvest in projects with high returns that exceed the cost of capital.
The importance of a company reinvesting in the business cannot be understated. Over long periods of time, it is the reinvestment of profits that drives future growth in the business. The growing capital base of the business supports growth in the top line, and feeds into a growing earnings stream and (assuming a stable dividend policy) a growing dividend stream.