Global Energy - July Commentary

Portfolio Manager, Specialist Team

Portfolio Manager, Specialist Team
This is a marketing communication. Please refer to the prospectus, supplement and KID/KIID for the Funds before making any final investment decisions. The value of this investment can fall as well as rise as a result of market and currency fluctuations. You may not get back the amount you invested.
Past performance does not predict future returns.
Global energy equities performed strongly over the first half of 2026, with the sector supported by a significant change in the oil and natural gas market backdrop after the outbreak of war in the Middle East and the subsequent disruption to flows through the Strait of Hormuz. Here, we explore the key developments in energy markets and the Guinness Global Energy Fund over the period, and consider the outlook.
Review of 1H 2026
Over the first six months of 2026, the energy market moved from a position of comfortable supply into one of material disruption. At the start of the year, the oil market was oversupplied, inventories were robust, and Brent oil traded just above $60/bl. OPEC+ had unwound a significant proportion of its voluntary cuts during 2025, non-OPEC supply was still growing, and the market only had limited focus on possible issues in the Middle East. By the end of February, geopolitical risk around Iran had intensified and the outbreak of war turned the Strait of Hormuz from a theoretical risk into the central constraint for global oil and LNG markets.
The scale of the disruption has been extraordinary. The Strait of Hormuz normally handles around 20m b/day of crude oil, condensate and oil products, as well as around 20% of global LNG trade. Since the outbreak of conflict, tanker traffic through the Strait has fallen to a fraction of normal levels. Pipeline re-routing through Saudi Arabia, the UAE and Iraq, strategic inventory releases, de-sanctioned barrels and the rebalancing of trade flows have helped to reduce the net disruption, but the market has still been left with a very large supply shortfall. By the end of June, we estimate that around 1.3bn barrels of oil supply has been shut in over the course of the conflict – equivalent to around 16% of global oil and product inventories.
Brent oil price and Brent five year forward oil price (US$/bl)
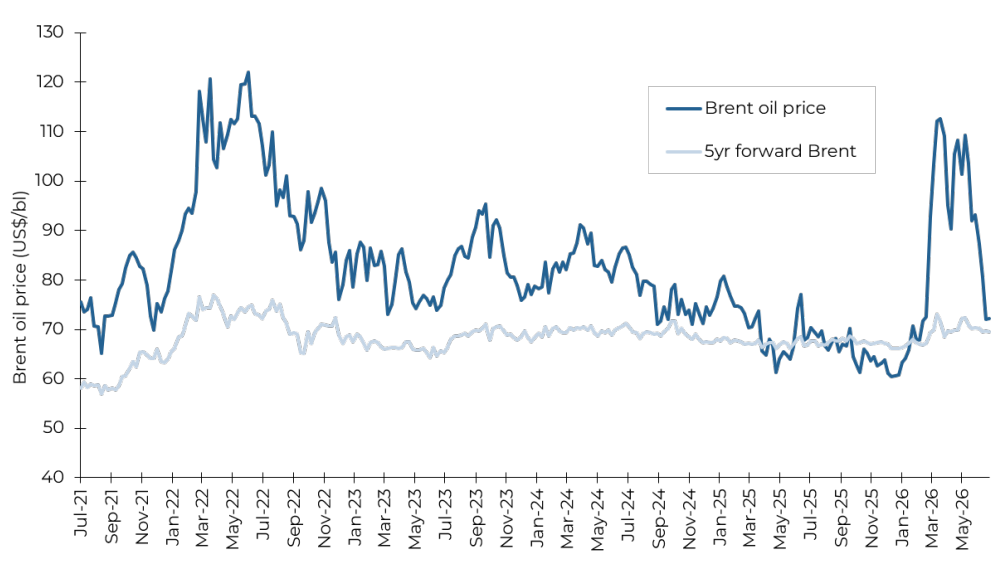
Source: Bloomberg; Guinness Global Investors, data as of 30.06.2026
Oil prices have therefore been volatile but, perhaps surprisingly, not as high as the scale of disruption might imply. Brent started the year at around $62/bl, rose above $120/bl during the first phase of the conflict, and then fell back as investors anticipated a reopening of the Strait and as evidence emerged that the system was finding short-term ways to cope. By the end of June, Brent stood at $72/bl, up 14% since the start of the year but well below the April peak. Brent oil has averaged $93/bl so far in 2026.
Four main factors have helped to limit the price response:
- The market entered the year with large buffers, including elevated oil and oil product inventories and substantial oil ‘on the water’ (in tankers or production vessels);
- Repeated optimism that a reopening of the Strait was imminent has weighed on forward prices, particularly because the Brent contract reflects delivery some weeks in the future;
- Trade flows adjusted rapidly: US seaborne net exports increased sharply and China reduced net oil imports, helping to reduce stress in the physical system; and
- It also seems likely that global oil demand has fallen sharply, as another adjustment to cushion the loss of Middle East supply. The IEA estimated that global oil demand was down around 4.6m b/day in April and 5.4m b/day in May.
Nonetheless, the cost of this adjustment has been a heavy drawdown in inventories. We estimate that oil and product inventories have been drawing at around 7m b/day, or around 200m barrels per month. As of the end of June, around 1.3bn barrels had already been lost to the market, and the total loss is likely to exceed 2bn barrels once the disruption and recovery phase are taken into account.
Global observed oil & product inventories (m barrels)
 Source: IEA, July 2026
Away from the Middle East, notable geopolitical developments in Venezuela and Russia also affected the oil market in the first half of the year. In Venezuela, the removal of Nicolás Maduro raised the possibility of a medium-term recovery in oil production from a very depleted base. Venezuelan production remains only around 1% of world supply and any meaningful recovery will require political stability, improved contract sanctity, sanctions relief, and significant foreign investment.
In Russia, meanwhile, Ukraine intensified its campaign against oil infrastructure, with drone strikes hitting a range of refineries and export terminals. The effect has been less about crude production itself and more about Russia’s ability to process crude into diesel, gasoline and other refined products. In April, Russia’s refined product exports were reported to drop to 4.7m b/day, the lowest level in 16 years.
The OPEC+ framework saw a material change, with the UAE announcing at the end of April that it would leave the group effective 1 May 2026. The immediate price impact was limited because the Strait of Hormuz remained the dominant issue and because the UAE cannot materially increase exports while flows are constrained. Longer-term, the decision reduces OPEC spare capacity outside the UAE and raises questions about group cohesion. Saudi remains the central actor in OPEC+, but it may now face both simpler decision-making and a greater share of responsibility for balancing the market.
Natural gas markets have also been affected by the Iran conflict. The Strait of Hormuz normally carries around 10-11 Bcf/day of LNG, representing around 20% of global LNG supply. QatarEnergy shut in production early in the conflict, with two Qatari processing lines damaged and likely offline for three to five years. International LNG prices rose sharply, with Europe and Asia competing for non-Middle Eastern cargoes at a time when European inventories were already lower than normal after winter. UK natural gas prices, a proxy for the European market, rose by 34% over the period, whilst Japanese LNG prices were up by 67%.
The US gas market has been somewhat insulated from the direct LNG disruption, though it has still been influenced by weather, LNG export demand and the broader global gas arbitrage. Henry Hub began the year strongly as winter storm Fern caused widespread wellhead freeze-offs and a record weekly inventory withdrawal, before prices moderated as weather normalised and inventories rebuilt. At the end of June, Henry Hub stood at $3.29/Mcf, down by around 11% since the start of the year.
Global natural gas prices (US$/mcf)
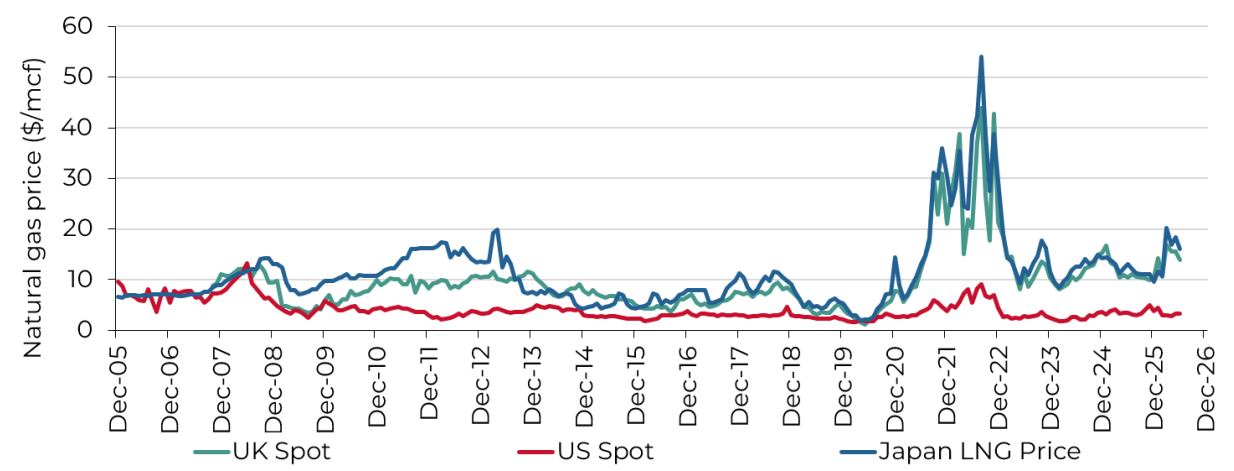
Source: Bloomberg; Guinness Global Investors, data as of 30.06.2026
The first half of 2026 saw strong absolute performance for energy equities, though the path was volatile. By the end of June, the MSCI World Energy Index had returned 18.5% in USD, in the broader equity market context of 9.7% for the MSCI World Index.
Performance was strongest during the initial escalation in March, but energy equities then underperformed the broader market in April and May as investors questioned why oil prices were not higher.
Within the Guinness Global Energy portfolio over the period, stronger performers included:
- European mid-cap integrateds: Repsol, GALP, Eni and OMV were among the strongest contributors during the first phase of the Iran conflict, helped by higher Brent-linked earnings and elevated refining margins.
- Oil services: Baker Hughes, Schlumberger and Halliburton performed well, supported at different points by expectations of higher service activity outside the Middle East, a rebuilding of damaged Gulf-based oil and gas facilities, and growth in LNG demand.
- Canadian integrateds and oil sands: Canadian Natural Resources, Suncor, Cenovus and Imperial Oil benefited from stronger oil prices and a renewed appreciation of secure, non-Middle Eastern supply.
- US refining: Valero and refining-linked parts of the majors (e.g. Exxon) were supported by tight product markets and the increasing importance of refinery flexibility as crude flows altered.
Sectors in the portfolio that were relatively weaker over the period included:
- Emerging market oils: PetroChina and Sinopec lagged over the period as Chinese government caps on refined product prices resulted in lower profitability for the Chinese majors versus Western peers.
- North American midstream: Enbridge, Kinder Morgan and TC Energy performed respectably in absolute terms, but with lower operating leverage to rising oil and gas prices than upstream-focused companies, were relative underperformers.
Outlook
As ever, the outcomes for spot oil prices in the short term are hard to predict. What is clearer is that the range of outcomes has shifted higher and that the market is underestimating the time required for the system to normalise, even if the peace agreement between the US and Iran does progress. The industry will need to rebuild working inventories, reposition tankers, repair infrastructure and restart fields. The market will also need to rebuild confidence in Gulf supply reliability. We therefore expect a tighter market in 2027 than was envisioned before the conflict. To expand on the Hormuz reopening issues, we summarise them broadly as follows:
- Confidence. Shipowners and crude shippers will need to be confident that the Strait is a genuinely safe place to operate. With the ceasefire now under threat, any confidence that has been building will be shaken. The passage of time, the safe passage of vessels and positive political momentum will be needed. In practical terms, a safe, mine-free route through the Strait needs to be delivered, and this could easily take weeks and months to be achieved.
- Tanker logistics. Tankers are now in the wrong places as many empty tankers have transited from outside the Gulf to West Africa or the United States to pick up other cargo rather than sitting idle outside the Strait. Getting tankers back into the right places will also take a number of weeks and, on its 1Q26 earnings call, Saudi Aramco's CEO called this "the biggest issue", adding that "even in the most optimistic scenario, the energy and commodity supply chains will need several months to return to their pre-conflict traffic, as vessels reroute or avoid being idle.”
- Field restarts. Many shut-in oil fields will have to be restarted very carefully, even when storage is available. With many fields now static, reservoir pressures and wellbore temperatures will have fallen, allowing wax and asphaltenes to build up and plug production tubing. These effects and other equipment-related issues will be overcome with time and money, but recovery is likely to be uneven across fields and countries.
- Infrastructure damage: We understand that physical infrastructure damage is mostly related to downstream facilities such as refineries, export and storage terminals and LNG facilities. These can also be resolved with time and money. As with vessels passing through the Strait, we imagine that downstream operators will want to see high levels of confidence before completing the rebuilding process, so near-term processing volumes will be constrained.
Putting all this together, we do not expect the oil export system in the Gulf to return to normality before the end of 2026. This is a view mirrored by a number of Middle East oil companies, most recently by Sultan Ahmed Al Jaber, CEO of ADNOC (Abu Dhabi National Oil Company): “Even if this conflict ends tomorrow… full flows will not return before the first or even second quarter of 2027”. As Saudi Aramco CEO Amin Nasser commented in early June, “If the Strait of Hormuz opens today, it will still take months for the market to rebalance, and if its opening is delayed by a few more weeks, then normalisation will last into 2027”.
In fact, we do not expect that we will return to the previous ‘normal’ for a significant period. A combination of longer-term reservoir damage, delayed infrastructure restarts and potentially restricted flow through the Strait itself means that the Gulf’s oil export system is unlikely to be considered as safe and reliable as it was. On the other hand, alternative export routes (e.g. pipelines) will be explored, albeit with high cost and complexity. When we look back on this conflict in the future, it seems likely that it will have redrawn the Gulf energy system very significantly, affecting supply and supply egress from the region in both positive and negative ways.
Looking beyond the Middle East crisis, the IEA recently published its first oil demand forecast for 2027. After an expected demand decline of 1.1m b/day (to 103.3m b/day) in 2026, the IEA is forecasting demand to rebound by 2m b/day in 2027 to 105.3m b/day. This would take global oil demand to a new high, surpassing 2025 demand by around 1m b/day. Demand growth of 2m b/day in 2027 is predicated on a normalisation of Gulf supply and an improving economic outlook, with global GDP growth assumed to rise to 3.3%. In addition, any decision by governments or companies to replenish strategic and commercial stocks would add further demand; replacing 2bn barrels over, say, the next two years, would imply around 3m b/day of additional oil purchasing.
Non-OPEC+ supply in 2027 is set to rebound by 2.5m b/day, supported by the expected normalisation in Gulf output (+1.4m b/day). Outside the Gulf, growth mainly comes from Central and South America. In Brazil, new field start-ups in the large Buzios field are expected to be a main driver for growth, whilst the Exxon-led consortium in Guyana brings further growth in Guyana.
Considering supply developments in the Gulf, the likely shape of supply elsewhere plus the picture for global demand, we maintain our Brent price forecast for 2027 of $80/bl (vs 2026 forecast of $90/bl).
Moves in energy equities so far this year have lifted valuations, but not excessively. At the start of 2026, we estimated that the portfolio reflected a long-term Brent oil price of around $67/bl. As a result of the conflict, we increased our 2026 Brent assumption to $90/bl. By the end of June, the portfolio's valuation implied a long-term Brent price of around $70/bl, still below the $80/bl level that we consider a reasonable long-term incentive price.
Energy companies: historic price to book valuation versus S&P 500
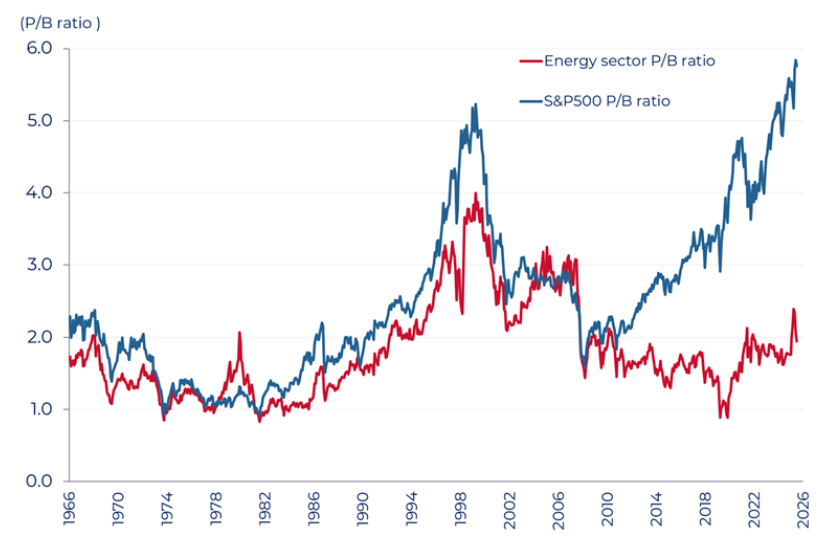
Source: Bernstein; Guinness Global Investors, data as of 30.06.2026
We keep a close eye on the relationship between the price-to-book (P/B) ratio for the energy sector and return on capital employed (ROCE), which historically shows a high correlation. The sharp rise in near-term oil prices should support reported earnings and cashflow in 2026 and 2027, but equity valuations still appear to discount a lower long-term commodity price than we think is realistic. If ROCE remains in a mid-cycle range and the market were to pay for it sustainably, we would expect a higher P/B multiple for the portfolio.

Source: Bloomberg, Company Data and includes analysis of all ‘full position’ holdings (for which 1998-2025 data is available) in the Guinness Global Energy Fund as of 03.07.2026
The higher ROCE is being supported by robust free cash generation. With our current 2026 and 2027 oil price assumptions, the portfolio should generate substantial free cashflow after capital expenditure, supporting fixed dividends, share buybacks and balance sheet improvement. In 2026, assuming a Brent oil price of $90/bl, we estimate a gross free cashflow yield for the portfolio of around 10%.
To consider valuation another way, we are often asked what oil price is implied in the portfolio, as a barometer of the expectation priced into the equities. At the end of June, we estimated that the valuation of our portfolio of energy equities reflected a long-term Brent oil price of around $70/bl. If the market were to price in a long-term oil price of $80/bl, we see around 30% further upside.
Upside/downside for Guinness Global Energy portfolio
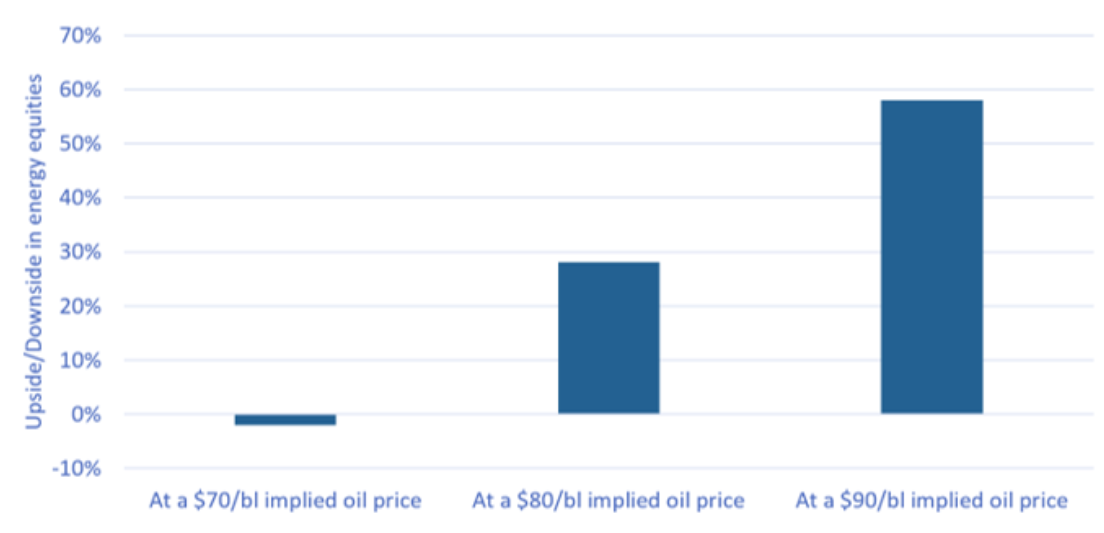
Source: Guinness Global Investors, 06.07.2026. Assumes $90/bl Brent in 2026, then the stated oil price into perpetuity from 2027 onwards
In summary, the first half of 2026 has seen extraordinary fundamental moves in the energy market. The year began with oversupply and low valuations; it has moved into a period of major supply disruption, rapid inventory draws and a reassessment of the reliability of Middle Eastern exports. Oil and gas prices have risen, but not to levels that fully reflect the risk of inventory operating stress, the length of the recovery process or the need to rebuild stocks. Energy equities have performed strongly in absolute terms, but valuations still appear to reflect a conservative long-term oil price. We therefore continue to see attractive upside in the Guinness Global Energy Fund, supported by robust free cashflow and disciplined capital allocation from our portfolio companies.
The value of this investment can fall as well as rise as a result of market and currency fluctuations. You may not get back the amount you invested.


The information provided on this page is for informational purposes only. While we believe it to be reliable, it may be inaccurate or incomplete. Any opinions stated are honestly held at the time of publication, but are not guaranteed and should therefore not be relied upon. This content should not be relied upon as financial advice or a recommendation to invest in the Funds or to buy or sell individual securities, nor does it constitute an offer for sale. Full details on Ongoing Charges Figures (OCFs) for all share classes are available here.
The Guinness Global Energy Funds invest in listed equities of companies engaged in the exploration, production and distribution of oil, gas and other energy sources. We believe that over the next twenty years the combined effects of population growth, developing world industrialisation and diminishing fossil fuel supplies will force energy prices higher and generate growing profits for energy companies. The Funds are actively managed and use the MSCI World Energy Index as a comparator benchmark only.
For the avoidance of doubt, if you decide to invest, you will be buying units/shares in the Fund and will not be investing directly in the underlying assets of the Fund
Documentation
The documentation needed to make an investment, including the Prospectus, the Key Information Document (KID) / Key Investor Information Document (KIID) and the Application Form, is available from the website www.guinnessgi.com, or free of charge from:
- the Manager: Waystone Management Company (IE) Limited (Waystone IE), 2nd Floor 35 Shelbourne Road, Ballsbridge, Dublin DO4 A4E0; or,
- the Promoter and Investment Manager: Guinness Asset Management Ltd, 18 Smith Square, London SW1P 3HZ.
Waystone IE is a company incorporated under the laws of Ireland having its registered office at 35 Shelbourne Rd, Ballsbridge, Dublin, D04 A4E0 Ireland, which is authorised by the Central Bank of Ireland, has appointed Guinness Asset Management Ltd as Investment Manager to this fund, and as Manager has the right to terminate the arrangements made for the marketing of funds in accordance with the UCITS Directive.
Investor Rights
A summary of investor rights in English, including collective redress mechanisms, is available here: https://www.waystone.com/waystone-policies/
Residency
In countries where the Funds are not registered for sale or in any other circumstances where their distribution is not authorised or is unlawful, the Funds should not be distributed to resident Retail Clients. NOTE: THIS INVESTMENT IS NOT FOR SALE TO U.S. PERSONS.
Structure & Regulation
The Fund is a sub-fund of Guinness Asset Management Funds PLC, an open-ended umbrella-type investment company, incorporated in Ireland and authorised and supervised by the Central Bank of Ireland, which operates under EU legislation. The Fund has been approved by the Financial Conduct Authority for sale in the UK. If you are in any doubt about the suitability of investing in the Fund, please consult your investment or other professional adviser.
WS Guinness Global Energy Fund
Documentation
The documentation needed to make an investment, including the Prospectus, the Key Investor Information Document (KIID) and the Application Form, is available in English from https://www.waystone.com/our-funds/waystone-fund-services-uk-limited/ or free of charge from:-
Waystone Management (UK) Limited, PO Box 389, Darlington DL1 9UF.
General enquiries: 0345 922 0044
E-Mail: iwtas-investorservices@waystone.com
Waystone Management (UK) Limited is authorised and regulated by the Financial Conduct Authority.
Residency
In countries where the Fund is not registered for sale or in any other circumstances where its distribution is not authorised or is unlawful, the Fund should not be distributed to resident Retail Clients.
Structure & regulation
The Fund is an Authorised Unit Trust authorised by the Financial Conduct Authority.
This Fund is registered for distribution to the public in the UK but not in any other jurisdiction. In other countries or in circumstances where its distribution is not authorised or is unlawful, the Fund should not be distributed to resident Retail Clients.