Our Approach to Executive Remuneration


In many cases, performance-based pay can make up the majority of overall remuneration for CEOs, and there is strong evidence to suggest that management incentive packages do indeed influence decision making and company strategy. This in turn can have a direct impact on a company’s operational results and therefore share price performance.
The structure of incentive schemes, the metrics used, targets set, and timeframes over which results are measured vary significantly, and we do not believe there is a ‘one size fits all’ approach to management remuneration. Indeed, it is important to differentiate between companies at different points in their life cycle; the best operational outcomes for an early-stage company which is investing to grow may be entirely different to those for a mature business where profitable growth prospects are limited.
Analysing remuneration polices and incentives can provide a useful signal as to where management’s attention is focused and act as a cross-check to determine if this is aligned with the interests of minority shareholders. Changing polices – for example, the metrics used to measure performance – can also show how a business is evolving and what the strategic priorities are.
Despite our belief that no particular policy is optimal, we do see certain measures that correlate more strongly with outperformance over time and conversely some measures that appear to have the opposite, undesirable effect. Broadly, we see returns-based measures such as return on capital most strongly linked to relative performance and top-line measures such as sales or market share – or bottom-line measures such as earnings per share (EPS) – least strongly (and, in some instances, negatively).
The former category broadly rewards strong capital discipline over ‘growth for growth’s sake’. Improvements in sales, for example, may come at the expense of margins, or an overemphasis on EPS may lead to reductions in investment in new projects which will lead to slower asset growth and therefore reduced profitability in the future.
We also see longer-term measures of success as superior to short-term time frames for much the same reasons; an overemphasis on short-term results may lead to poor capital allocation decisions that lead to inferior long-term operational results and therefore cash flows and ultimately value creation. More recently, we have also begun to see the explicit inclusion of ESG metrics as part of management remuneration policies. Again, different measures will be appropriate for different businesses – for example, carbon reduction targets may be more material for an industrial business, or diversity and inclusion for a high-IP technology business.
Our investment process is targeted at quality companies with high returns on capital where we believe these can be maintained over the longer term. Understanding whether management teams are incentivised to focus on achieving these goals is therefore an important part of our analysis of the investment case, and if other outcomes are prioritised, why this might be. It also enables us to engage with businesses to encourage more optimal incentives, whether through proxy votes or through direct discussion with the company.
Executive Compensation Construction
Remuneration packages vary but can be broadly deconstructed in two ways: fixed vs variable and short-term vs long-term. While fixed pay tends to include salary alone, the variable portion can be made up of a combination of bonuses, stock units and stock options, with pay-outs often linked to pre-set criteria. The ratio of fixed to variable pay is often used as a crude indicator of remuneration quality; a higher proportion of variable pay is deemed preferable, as it links management compensation more closely to the success of the business.
Remuneration packages are then often assessed over short and long-term timeframes to reward good results within the business (or individual performance) and to incentivise longer-term strategic goals. Typically, bonuses linked to short-term business and individual performance are assessed over the prior year, while long-term remuneration is usually linked to multi-year performance metrics such as cumulative earnings-per-share appreciation, for example, which may be measured over 3+ years. Both short and long-term remuneration may come in the form of PSUs, RSUs, options or cash and may have caveats such as clawbacks associated with the rewards.
While there is no ‘correct’ ratio of short to long-term remuneration, as long-term investors we prefer to see company management primarily incentivised by long-term business metrics that are aligned to value creation, as opposed to short-term share price performance metrics that are more likely to be ‘one-offs’ or inflated by accounting methods.
However, complex remuneration packages abound, using PSUs, RSUs, and options with either sub-optimal strategic goals, opaque remuneration structures or even no long-term plan. Historically, cash made up the majority of remuneration through salaries, bonuses and long-term rewards. However, since 2010 – using the S&P500 as a proxy – equity rewards have become an increasingly used method of remuneration, on average encompassing 50% of CEO remuneration in 2018 versus just 31% in 2010. Conversely, the use of share options – once a popular form of remuneration before accounting scandals and malpractice such as that seen at Enron, where stock options were used to inflate a company’s reported earnings – has been on a downward trajectory.
Components of Executive Compensation:
- Salary: Fixed annual compensation linked to job description
- Bonus: Variable cash payout based on individual and corporate performance over the prior year
- Performance Share Units (PSU): Stock compensation rewarded only if certain pre-defined corporate and individual criteria are met
- Restricted Share Units (RSU): Stock-based compensation similar to PSUs which may not be contingent on pre-defined metrics but instead vest over a specific length of employment
- Share options: Gives employees the right, within a specified timeframe, to purchase a set number of shares at a pre-set price
- Other: Includes pension benefits, employee perks such as company vehicles, and other non-monetary benefits such as insurance.
We prefer to see company management incentivised by long-term business metrics.
Average mix of total CEO compensation by fiscal year, S&P 500
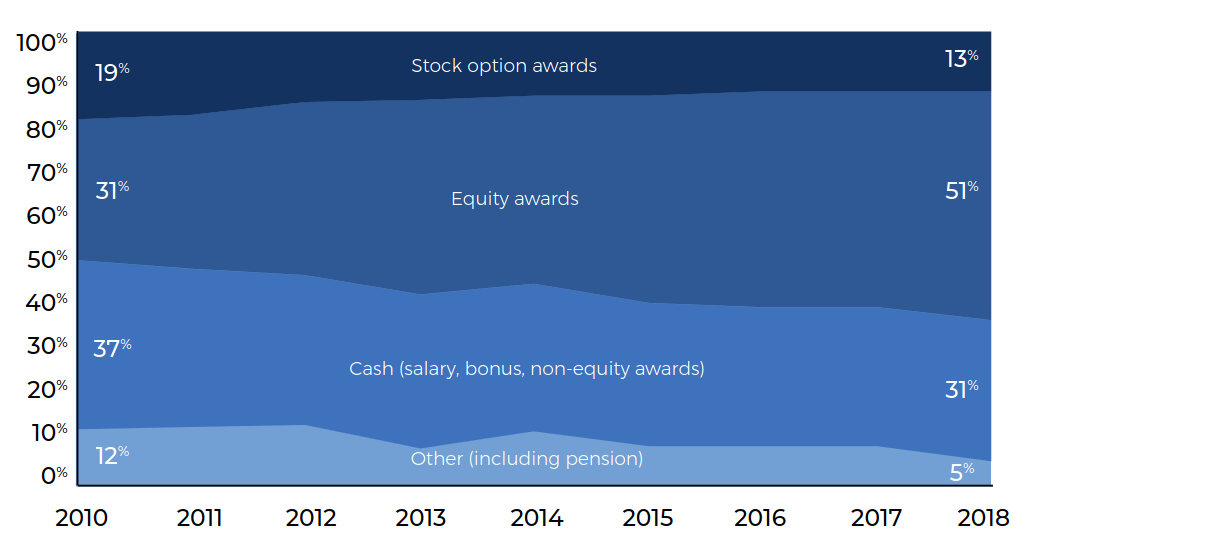
With the average S&P 500 CEO pay in 2018 including 56% from remuneration directly linked to the performance of the business (21% based on short-term performance and 35% from long-term performance), it is important for remuneration committees, and indeed investors, to ensure executive pay is tied to the most optimal metrics relevant to a company and its long-term strategy. This is to ensure that it translates into the best operational results which should lead, ultimately, to better relative share price performance.
We believe businesses should provide clear and transparent targets to hold management accountable, while continuing to assess the relevance of the performance metrics used to ensure they remain aligned to the company’s long-term strategy. This involves using a few targeted metrics as opposed to a broad array of metrics which can dilute the goal of remuneration alignment.
Overuse of Total Shareholder Return (TSR):
Looking at the metrics businesses tend to use in their long-term and short-term incentivisation plans (LTIP & STIP) across the US and Europe, there is a growing tendency, especially in the US, to use total shareholder return (TSR) within LTIPs. Ultimately, we are opposed to companies using TSR as a sole metric, as we view share price appreciation as an output from better operational results rather than a target in itself. Share price performance may also come from things outside of management control such as shifts in investor sentiment based on the economic cycle, for example, which can be positive or negative. There is also a case that using TSR as an incentive ‘doubles down’ on the share price metric, as senior management tend to be already adequately aligned via stock holdings (many companies require executives to hold a certain proportion of their wealth in company stock) or potential stock awards from options or RSUs and PSUs.
Fundamentally, total returns are linked to long-term economic profit creation. As such, having a focus on return-based metrics such as return on capital focuses management on re-investing cash in the most optimal way that will generate economic profit.
Lack of emphasis on return-based measures:
Within the S&P 500 in 2019, only one-third of companies incorporated a return-based metric, versus almost two-thirds of companies using TSR. Fundamentally, total returns are linked to long-term economic profit creation – that is, deploying cash into projects with returns above the cost of capital. As such, having a focus on return-based metrics such as return on capital focuses management on re-investing cash in the most optimal way that will generate economic profit – as opposed to merely deploying cash in a systematic manner or in a way that may inflate short-term accounting measures at the expense of long-term operational efficiency. The ‘wonderful companies’ that outperform consistently and generate significant relative outperformance over the long term are typically those that successfully compound over time, re-investing cash flows only into profitable projects while maintaining strict attention to operational performance.
Poorly defined or broad measures of success:
Transparency of approach is obviously important in assessing incentives, both for investors and the management teams themselves. Broad measures such as share price performance relative to an index that includes companies not in the same industry, or a group of peers that are not relevant, do not focus management effectively and can often lead to comparison of metrics which are outside of management control. These may reward poor management decisions unnecessarily or fail to reward good decisions without good cause, either of which is suboptimal from a minority shareholder point of view.
Use of non-material ESG metrics:
ESG metrics are increasingly used to assess short-term executive performance, echoing the wider calls for improved ESG disclosure by corporations and integration within portfolio construction. More prevalent in Europe than in the US, remuneration committees are increasingly cognisant of material ESG issues and their potential impact on business performance. While we are encouraged by this trend and see this as a long-term positive, we would reiterate that metrics used in assessing performance need to remain relevant to the specific company’s long-term strategy, and as such, ESG metrics, if used, need to remain material to the company.
So, what are the optimal metrics?
Ultimately, we do not believe there is one metric or group of metrics that is optimal for every company. Incentives work on a case-by-case basis dependent on the company’s long-term strategy. It is important to differentiate between companies at different points in their life cycle; the best operational outcomes for an early-stage company which is investing to grow may be entirely different to those for a mature business where profitable growth prospects are limited.
We identify certain measures that correlate more strongly with outperformance over time and conversely some measures that appear to have the opposite, undesirable, effect. As mentioned previously, we believe TSR is overused, alongside EPS. TSR can be outside of management control and used in remuneration packages measured against non-specific benchmarks. EPS is an accounting measure and therefore more susceptible to ‘manipulation’ (compared to a cash flow measure). The use of TSR or EPS in LTIPs can result in lower investment through R&D and capex expenditure, and in the case of EPS, an increased use of buybacks to inflate reported earnings via lower share counts. Although neither can be seen as unequivocally ‘bad’ – it may indeed be the best use of cash to buy back shares if a company is currently undervalued, for example – in general they create incentives that could result in suboptimal capital allocation from a minority shareholder point of view.
Conversely, the use of return on capital as an incentive measure has been linked to higher investment in future growth via R&D spend and capex, operating margin expansion and ultimately superior peer-relative EPS growth, relative share price performance and higher cash returns to shareholders through both buybacks and dividends over the long term.
Incentives work on a case-by-case basis dependent on the company’s long-term strategy.
Additional considerations:
We have only touched upon a few important points regarding executive remuneration. There are many more to consider, including performance periods used, vesting periods, clawback provisions and others. Broader complexities to this work include the following:
Active owners – Companies which are led by younger founders or are family-run often have company incentives and alignment with shareholders which centre around very high and long-term equity ownership. In fact, for such companies there is often little correlation between incentive packages and long- run performance, as founders often restrict basic pay and focus on long-term growth above profitability in the near term. This can be a very successful model and is very different to the returns-based measures we emphasise above, albeit with significant risks.
Regional and sector norms – While differences in the ‘normal’ structures of remuneration plans between different regions or sectors can add complexity, it should not deter investors from striving for the optimal remuneration frameworks. For example, as we noted previously, businesses in the US tend to place greater emphasis on TSR in LTIPs than their European counterparts. So, while a US company using TSR as an objective within its executives’ LTIPs may be the norm, it should not necessarily be considered optimal.
Quantum – Aside from the design and construction of remuneration plans, it is also important to assess the absolute level of payment a CEO receives. Having a well-constructed plan is all very well, but if a CEO is being rewarded disproportionately to the business’s operational performance (and when considering peer remuneration), this may point to poor governance. There are several factors that can influence the appropriateness of total remuneration, including company size. Although businesses must suitably incentivise CEOs in order to retain them, we remain mindful of the absolute level of pay alongside the remuneration plan that determines that pay.
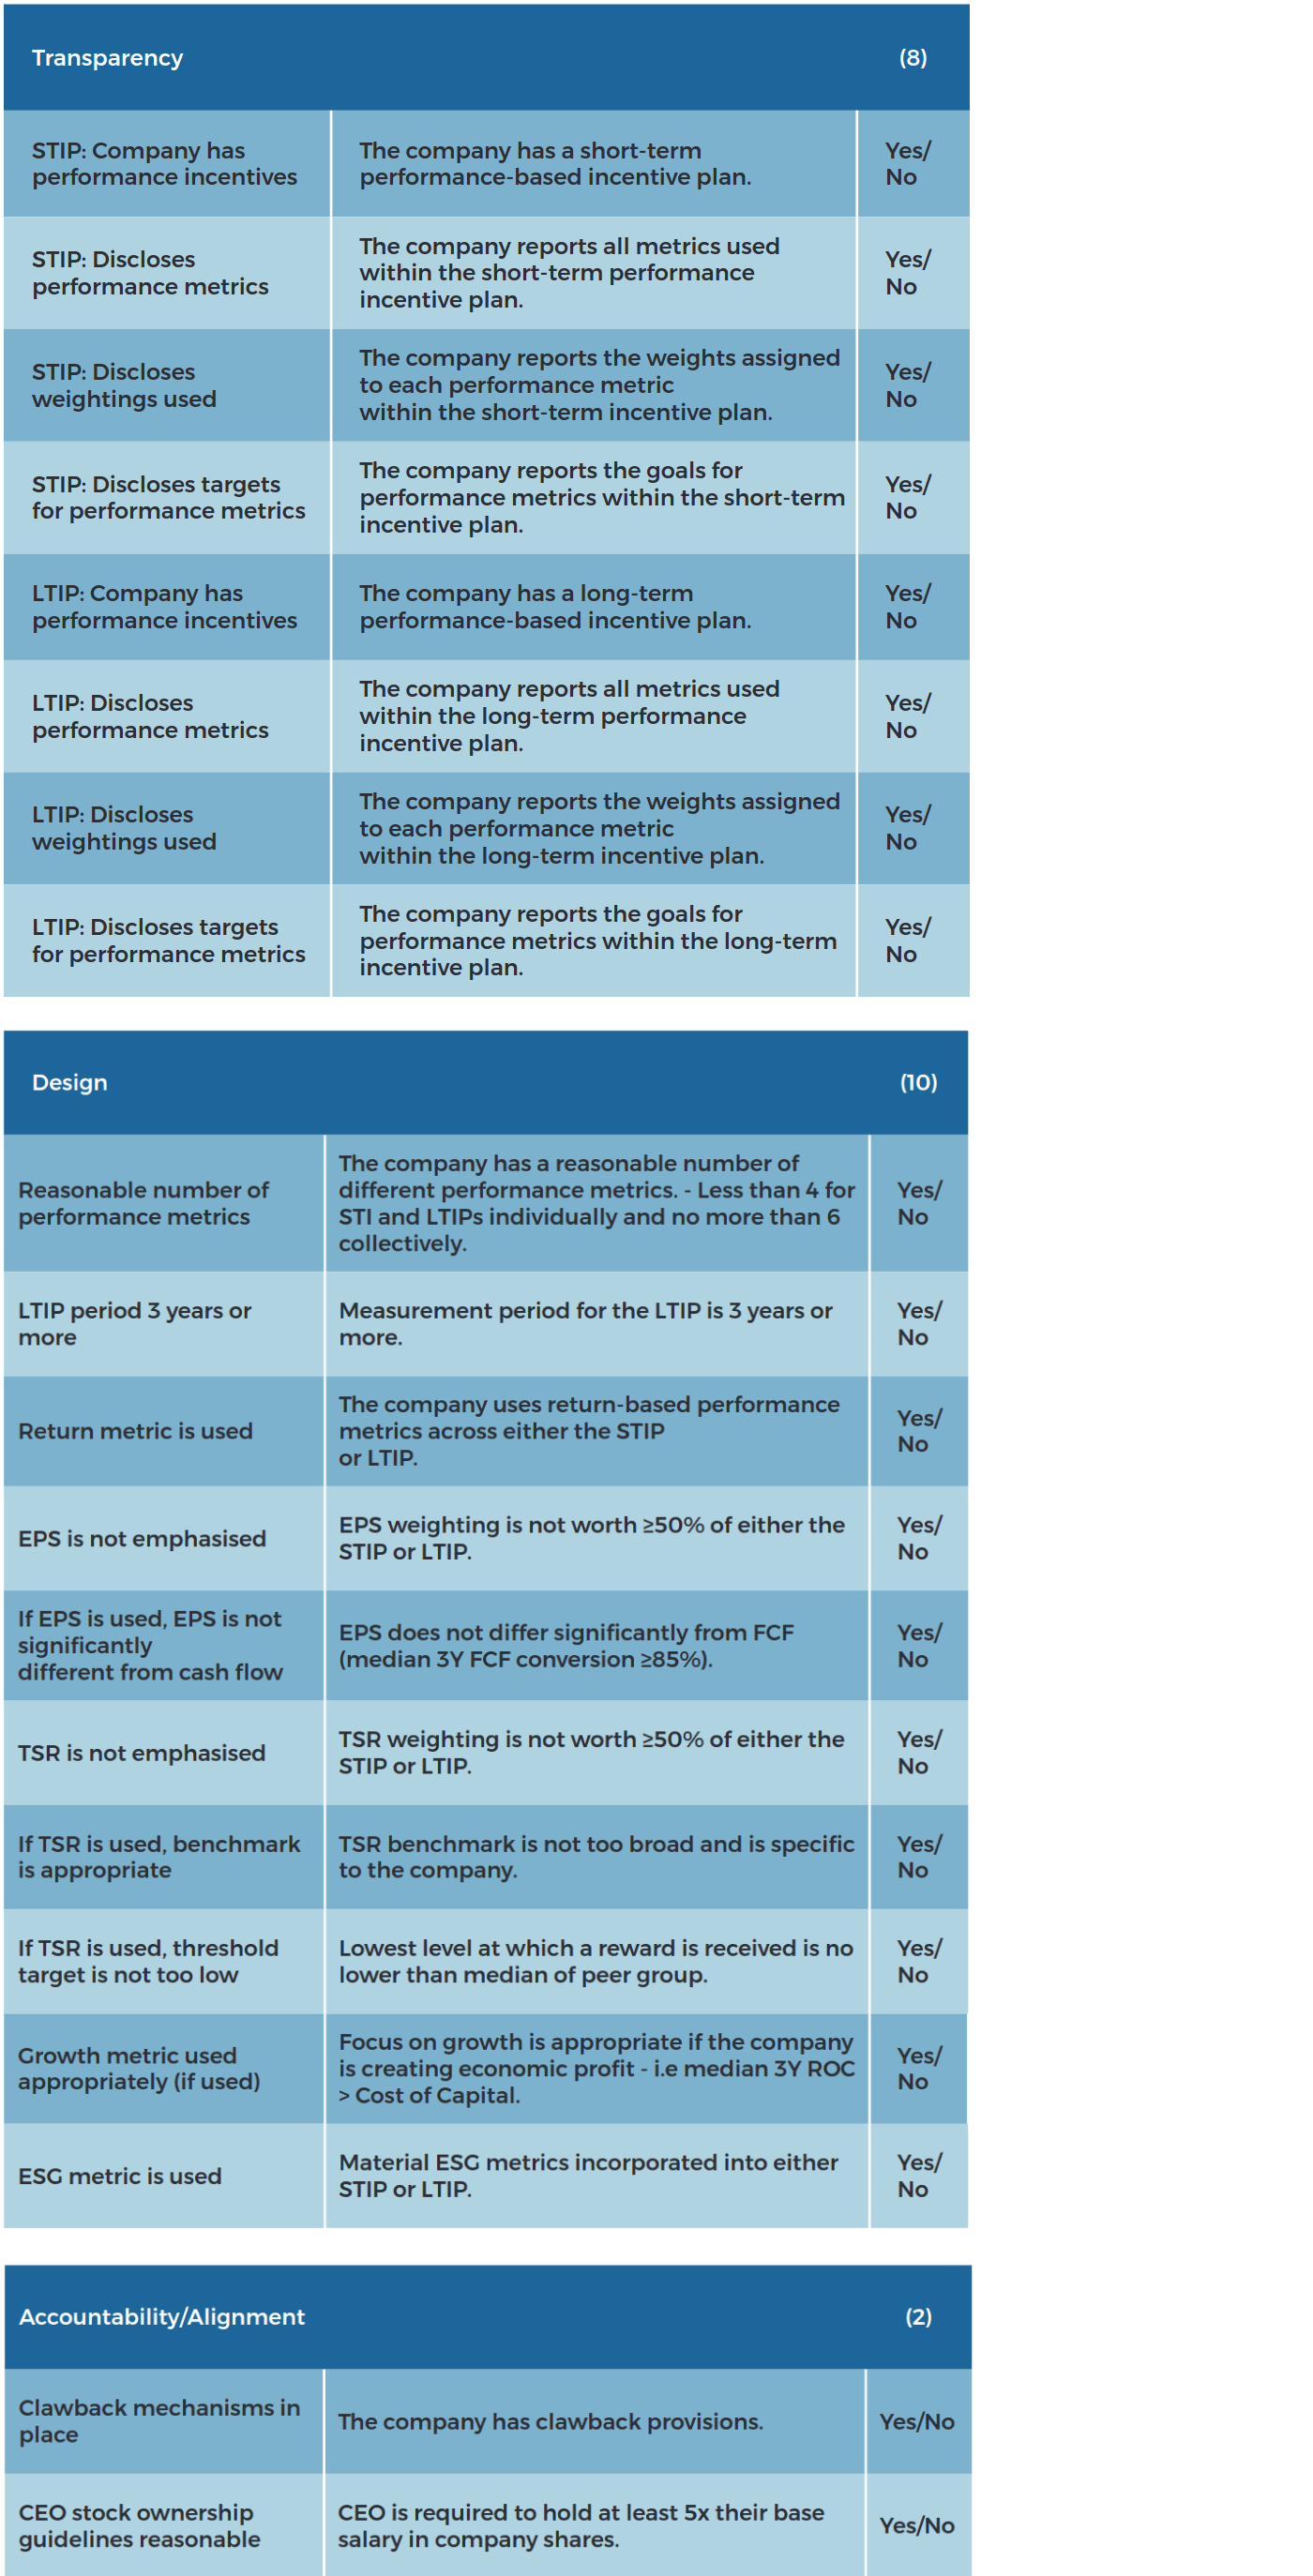
We employ a scorecard system to assess a company’s remuneration framework across 3 pillars.
So, what do we do?
As we have said, executive remuneration can be complex. Taking a step back, we would like to see companies with transparent, easy-to-understand remuneration plans with logical rationales as to the chosen structure, which should align management to the operational results of the business while holding them accountable for the subsequent performance.
To begin to understand the remuneration structures of investee or potential investee companies, we employ a scorecard system to score and rank businesses systematically across 3 pillars. The criteria of our scorecard aim to quantify the approach we describe above using a manageable list of what we believe to be the most important factors in assessing executive remuneration plans.
We can then assess the company’s remuneration framework across the 3 pillars for alignment to ‘best practice’, and determine areas of weakness. This enables us to engage with businesses to encourage more optimal incentives, whether that be through proxy votes or through discussion with the company directly. Our system assesses remuneration plans across 3 individual pillars:
- Transparency – Does the company disclose all relevant information needed to assess and hold management accountable?
- Design – What metrics are used within the STIPs and LTIPs and do they align with our philosophical approach? Are any material ESG metrics incorporated into the design?
- Accountability & Alignment – Are there policies and mechanisms in place to ensure appropriate accountability and alignment of management to company goals?
Companies are assessed within each of the 3 pillars across 8, 10 and 2 metrics respectively with higher scores giving an indication of better constructed frameworks.
Our Approach to Assessing Executive Compensation Construction
EXAMPLE EVALUATIONS

ILLINOIS TOOL WORKS (ITW)
Business description: ITW is a global manufacturer of engineered components for multiple industries including automotive, construction, electronics and welding. The business operates a decentralised operating model with each underlying business focused on niche markets. In 2012, ITW launched its Enterprise Strategy to position the company for growth with best-in-class margins and returns. Within this, management took the approach to shift their primary growth engine to organic growth.
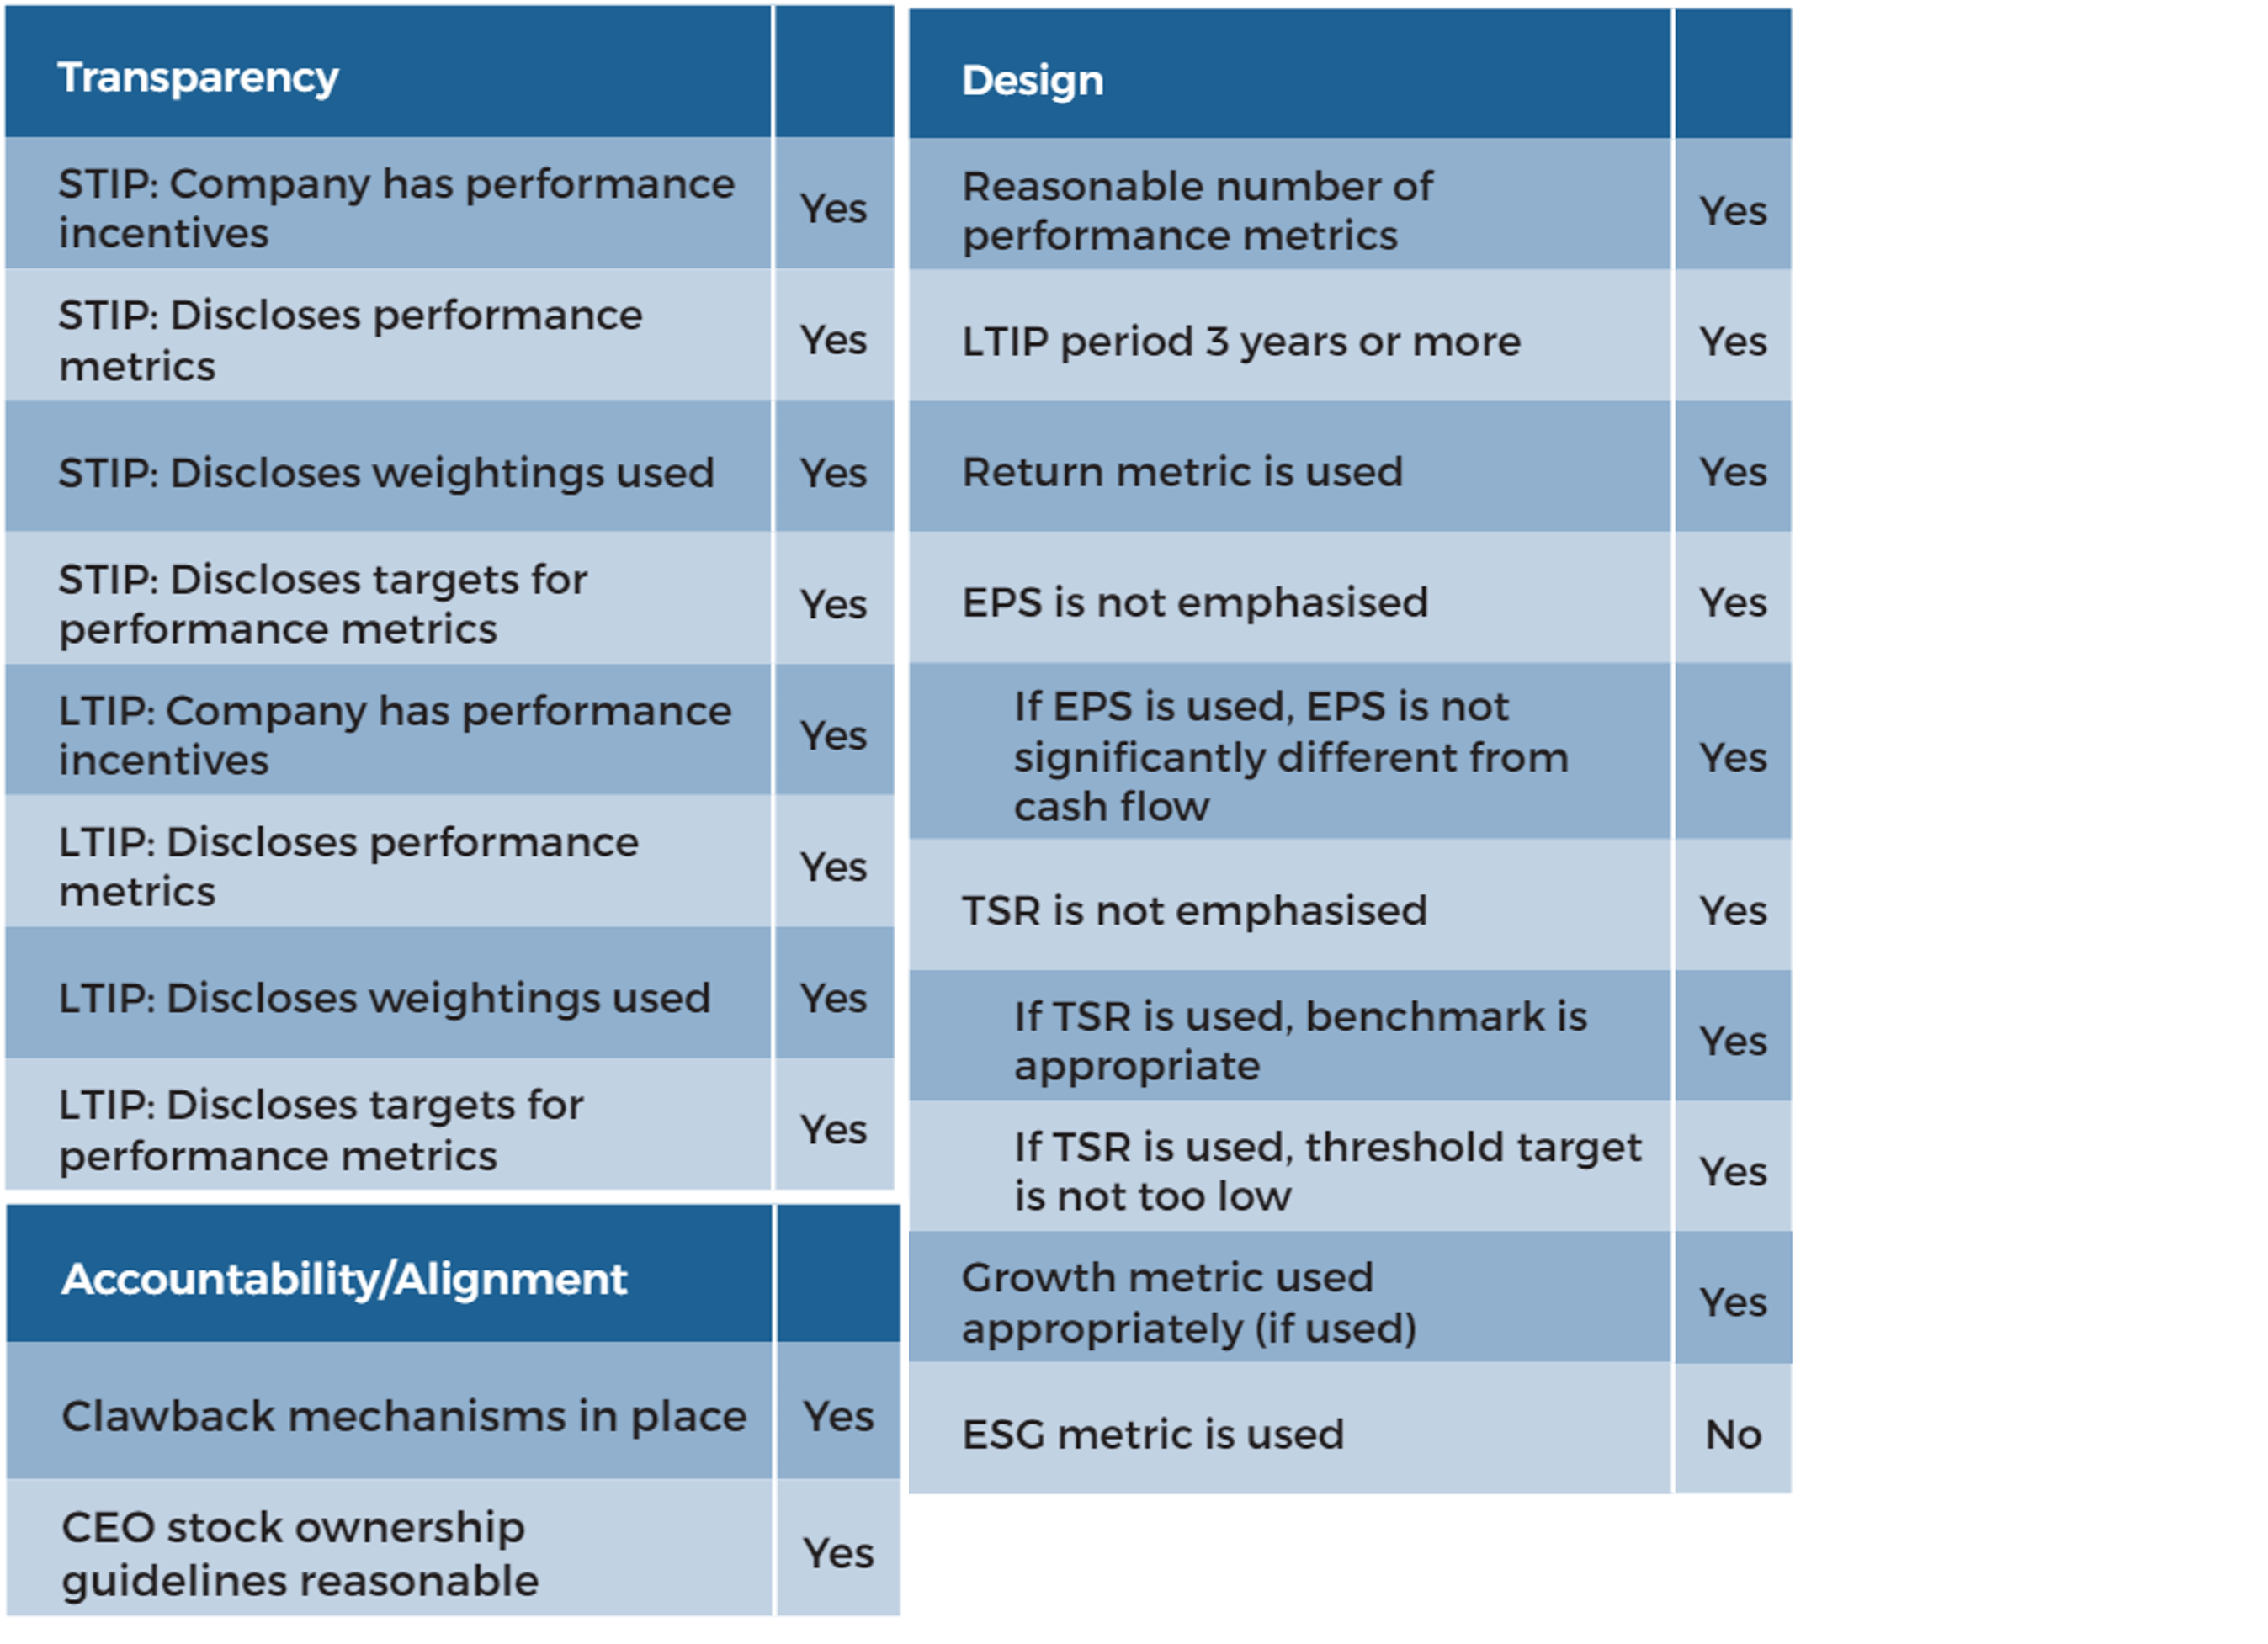
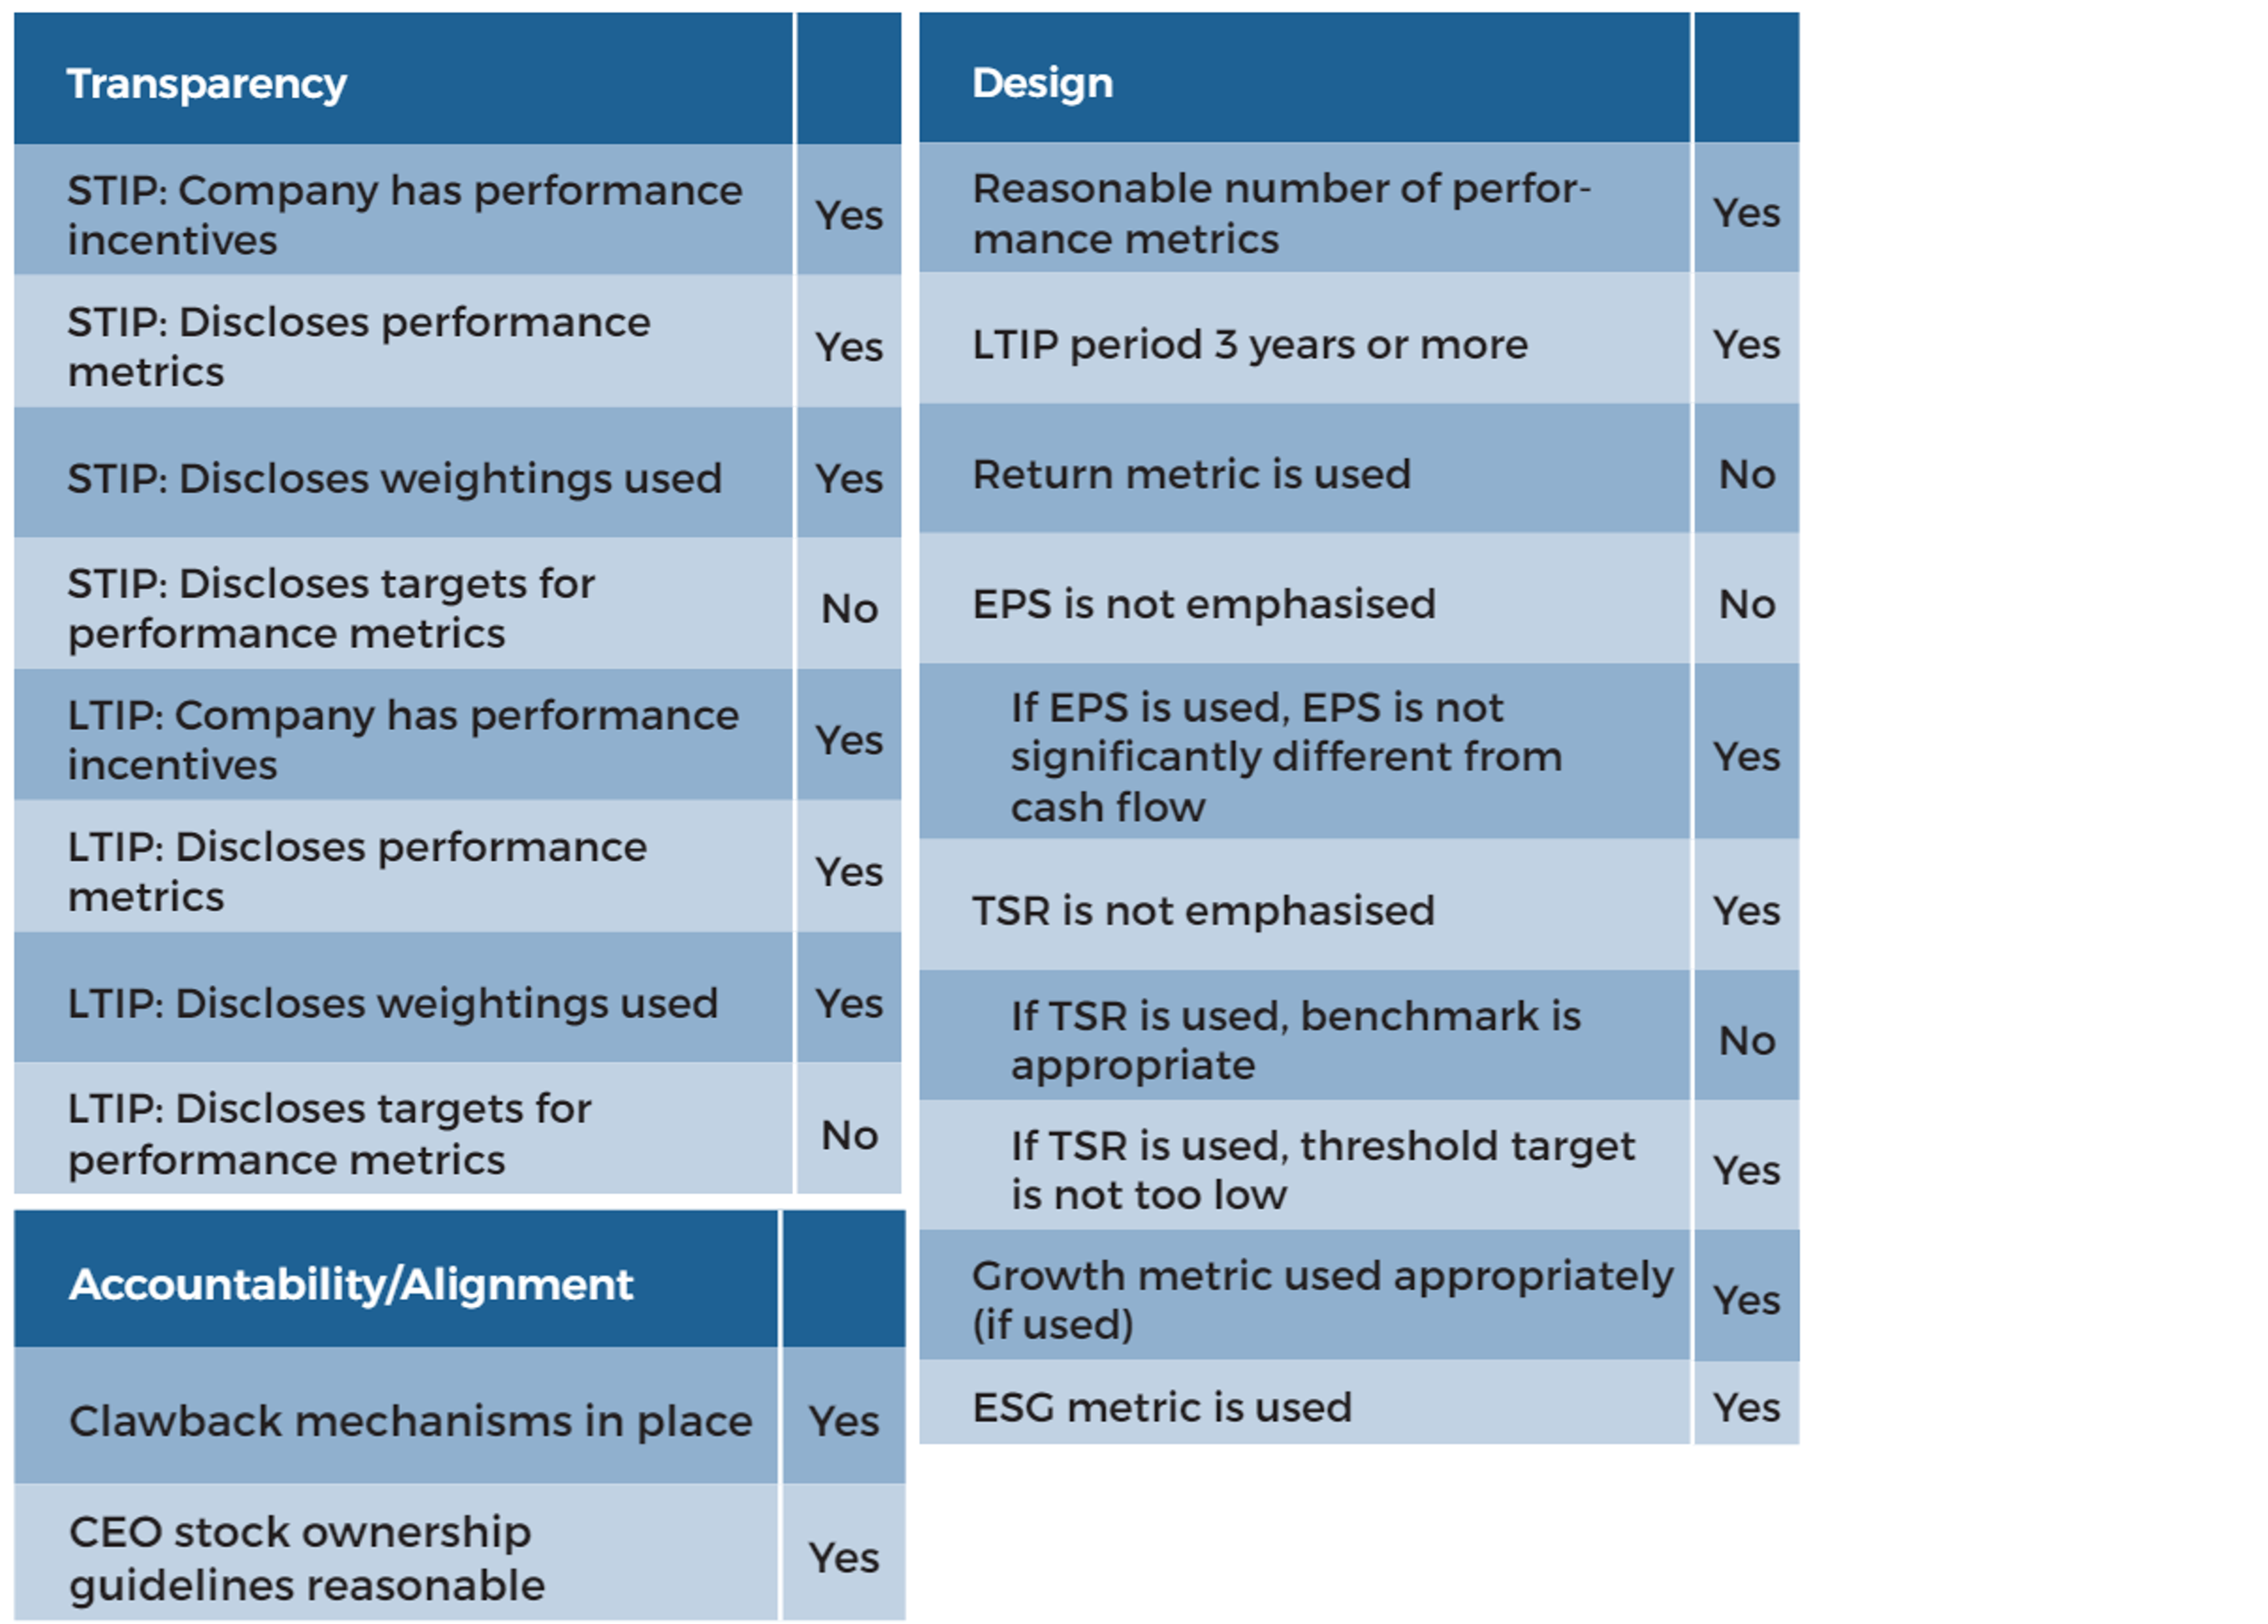
Guinness Global Team scorecard
Assessment:
ITW is transparent with all metrics used, its weightings and its targets. The company uses appropriate metrics, clearly linked to its ongoing Enterprise Strategy which since 2012 and notwithstanding the impacts of the global pandemic in 2020 has seen its operating margin increased from 15.9% to 22.9%, after-tax ROIC increased from 14.5% to 26.2%, EPS increased by a compound annual growth rate of 9%, and the company’s market capitalisation nearly tripled.
Aside from this, the company measures the LTIP over an adequate time frame (three years), requires the CEO to hold a considerable amount of wealth in the company’s stock (6x salary), and has clawback measures in place.
Furthermore, the company does not use any time vesting RSUs and as such does not reward the CEO for merely ‘sticking around’. The company does use stock options, purely linked to share price performance, but we believe this is not egregious relative to the 50% weighting towards performance-related stock and cash awards.
As can be seen to the left, the only potential area of improvement would be the inclusion of an appropriate ESG metric. ITW falls within the Industrial Machinery & Goods Sustainable Industry Classification System (SICS) Industry, and as such may be more exposed to energy- intensive processes and employee health & safety issues.

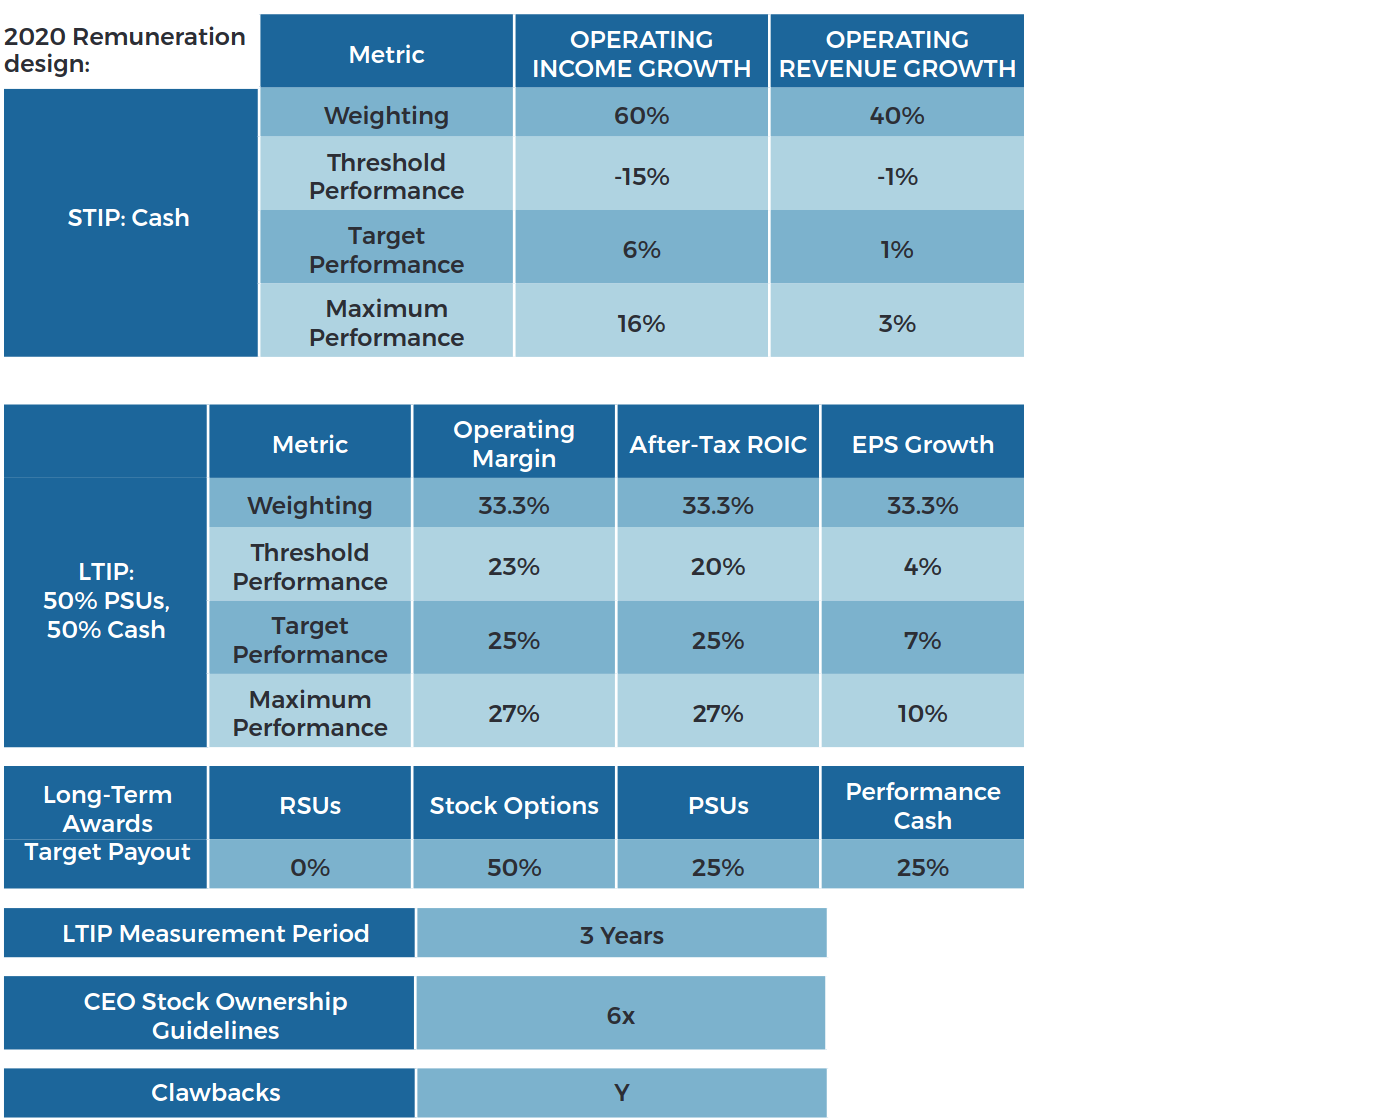
HP is one of the largest providers of personal computing and printing solutions. These include notebook PCs and displays, as well as printing hardware, supplies and services. The business is currently in the midst of a capital-returns strategy for shareholders, through cost cuts and share buybacks.
2020 Remuneration design:
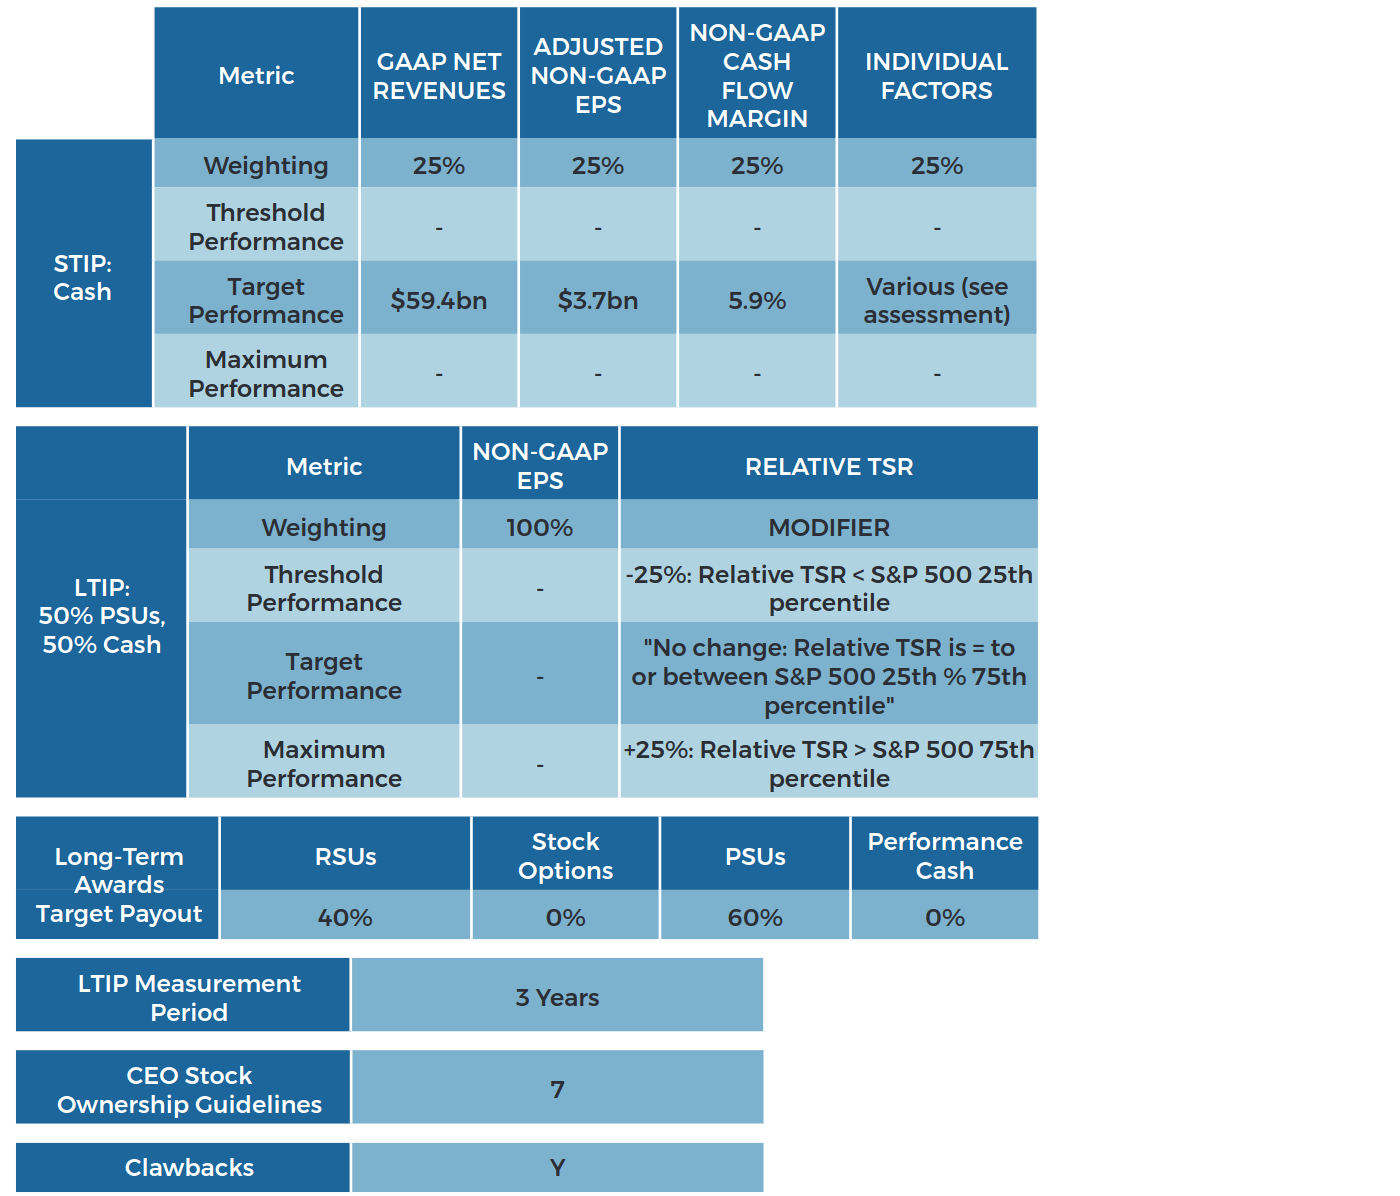
Guinness Global Team scorecard
Assessment:
While HP is transparent with the metrics and weights used, it only reports the targets for performance metrics within the STIP (no threshold or maximum), whilst not reporting any target information for the LTIP. The company reports this data after the measurement period has finished, which, in our view, does not lend itself to high levels of accountability.
With respect to the metrics used, the STIP metrics do not seem inappropriate, although we find using an EPS measure as the sole metric within the LTIP suboptimal. Additionally, while the use of a TSR modifier is not in itself especially poor, the measurement vs a broad benchmark such as the S&P 500 is not relevant.
This said, HP does use a sufficient LTIP measurement period (3 years), has appropriate stock ownership guidelines (7x salary), and has clawback mechanisms in place. While the individual component of the STIP consists of fairly broad qualitative measures (including strategic direction of the company and balancing investment choices), it does include ESG metrics material to an IT company like HP, including talent programmes, employee engagement, and company culture and diversity – although we would ideally like to see these being outright components rather than part of a broader list.
Disclaimer: This Insight may provide information about Fund portfolios, including recent activity and performance and may contains facts relating to equity markets and our own interpretation. Any investment decision should take account of the subjectivity of the comments contained in the report. This Insight is provided for information only and all the information contained in it is believed to be reliable but may be inaccurate or incomplete; any opinions stated are honestly held at the time of writing but are not guaranteed. The contents of this Insight should not therefore be relied upon. It should not be taken as a recommendation to make an investment in the Funds or to buy or sell individual securities, nor does it constitute an offer for sale.
Certain incentive metrics correlate more strongly with operational and share price outperformance over time and conversely some measures appear to have the opposite, undesirable effect.