Sustainable
Having an ‘A-ha’ moment on battery electric vehicles
By Seb Beloe

Life-cycle studies are used to test the claim that manufacturing emissions cancel out the benefits of battery electric vehicles.
Not all readers I imagine will have fond memories (or indeed any memories!) of the Norwegian pop group ‘A-ha’. During the late 1980s the group was one of the most popular bands in the world. What is not so well known is that A-ha were dogged campaigners for battery electric vehicles (BEVs) and are now seen as having been influential in helping Norway into ‘pole-position’ in the race to convert to BEVs.¹
At WHEB, we are also big fans of BEVs. Approximately 8% of the strategy is invested in companies with exposure to BEVs and their value chains such as Aptiv, Infineon and TE Connectivity. We’ve even launched a policy enabling employees to access a BEV leasing scheme giving them easier and cheaper access to BEVs.
Are BEVs better for the environment than ICEs?
But not everyone is a fan. The most common argument levelled against BEVs is that the negative environmental impact of manufacturing BEVs outweighs any positive benefits associated with operating the vehicle. This is often followed up with a ‘and if the electricity is provided by coal, it is even worse’ line of argument.
It is amazing how durable this argument has been. And like a lot of deceptions, it contains an element of truth. Building a BEV does indeed produce more CO2 emissions than building an internal combustion engine (ICE) vehicle. This is almost entirely due to the manufacturing of the battery. An average BEV will have more than twice as much copper and manganese as an ICE and will have a lot more lithium, nickel, manganese, cobalt and graphite. In all more than five times as much metal (by weight) as in an equivalent ICE.²
It's the life-cycle stupid
But the key point is that across the whole life-cycle of a road vehicle, manufacturing represents a small part of the overall footprint. Road vehicles use a lot of energy in their use. Much more in fact than that which goes into their manufacturing. And this, of course, is where you see the real benefit of a BEV.
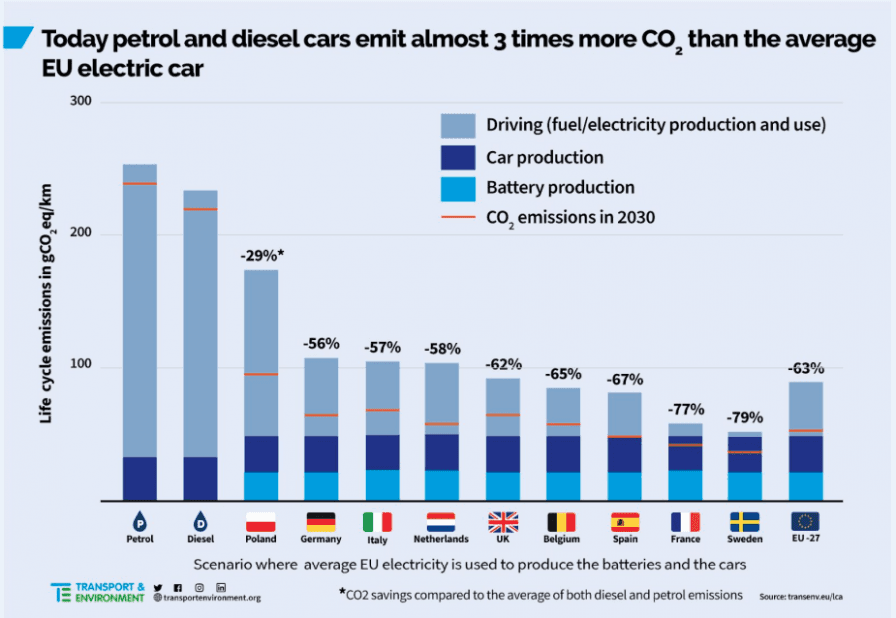
Transport and the Environment (T&E) was the group that uncovered ‘dieselgate’ at Volkswagen, and they conducted an extensive life-cycle analysis of BEVs versus equivalent ICEs using both diesel and petrol. Their analysis showed that across multiple geographies, in every case BEVs were significantly better in terms of life-cycle CO2e emissions than the ICE equivalents. In Poland, where coal dominates power generation, CO2e emissions were 29% lower for BEVs. In low carbon Sweden emissions were 79% lower. Similar studies by Bloomberg New Energy Finance³, the University of Michigan⁴ and the International Energy Agency⁵ have all reached the same conclusion.
T&E study on life-cycle emissions from vehicles in different European countries⁶
BEVs benefit from the fact that electric motors are typically very efficient. Approximately three-quarters of the energy that is put into a BEV motor is converted into power that drives the vehicle. For an ICE vehicle, the equivalent number is somewhere between 12-30%.⁷
It’s getting better all the time
At the same time, grid electricity is being progressively decarbonized. As renewables are added to electricity grids and fossil fuels are phased out, BEV outperformance just gets better and better. There are also likely to be improvements in the manufacturing phase as well. The metals in the battery are expensive and highly recyclable. Battery manufacturers are very keen to use as much recycled materials in their batteries as possible. NorthVolt expect to be sourcing 50% of their raw materials from recycled sources by 2030. CATL think that they will eventually get to 100%.⁸ This will improve relative performance even further.
¹ https://www.whichcar.com.au/car-news/how-a-ha-helped-norway-ev-incentives
² https://www.iea.org/data-and-statistics/charts/minerals-used-in-electric-cars-compared-to-conventional-cars
³ https://about.bnef.com/blog/the-lifecycle-emissions-of-electric-vehicles/
⁴ https://iopscience.iop.org/article/10.1088/1748-9326/ac5142
⁵ https://www.iea.org/data-and-statistics/charts/comparative-life-cycle-greenhouse-gas-emissions-of-a-mid-size-bev-and-ice-vehicle
⁶ https://www.transportenvironment.org/wp-content/uploads/2020/04/TEs-EV-life-cycle-analysis-LCA.pdf
⁷ https://www.fueleconomy.gov/feg/evtech.shtml
⁸ https://www.economist.com/leaders/2022/10/27/battery-makers-are-powering-a-circular-economy
Risk: The WHEB Environmental Impact Fund, the WHEB Sustainable Impact Fund and the FP WHEB Sustainability Impact Fund are Equity funds. Investors should be willing and able to assume the risks of equity investing. The value of an investment and the income from it can fall as well as rise as a result of market and currency movement; you may not get back the amount originally invested.
This is marketing communication. Please refer to the prospectus, supplement and KIID/KID for the funds, which contain full information on the risks and detailed information on their characteristics and objectives, before making any final investment decisions.
Disclaimer: This insight may provide information about Fund portfolios, including recent activity and performance and may contain facts relating to equity markets and our own interpretation. Any investment decision should take account of the subjectivity of the comments contained in this insight. This insight is provided for information only and all the information contained in it is believed to be reliable but may be inaccurate or incomplete; any opinions stated are honestly held at the time of writing but are not guaranteed. The contents of this insight should not therefore be relied upon. It should not be taken as a recommendation to make an investment in the Funds or to buy or sell individual securities, nor does it constitute an offer for sale.