Sustainable
From villain to saviour – renewable energy is coming to the rescue
By WHEB Investment Team
How falling solar and wind costs position renewables to meet accelerating electricity demand from data centres, heat pumps and electric vehicles.
In a previous life, I was a sell-side analyst for the solar power sector which became a “hot topic” in 2004. Germany had introduced the “Erneuerbare Energien Gesetz” (EEG) or Renewable Energy Sources Act and generously subsidised solar installations. The holy grail was achieving solar panel prices of just $1/Wp in order to get to retail electricity price parity. At the time, this was still a very distant dream.
The EEG drove massive solar installation growth but the mechanism simply folded the subsidy into the consumer retail price and soon this became a noticeable inflationary cost factor to the dismay of the German retail electricity customers. Solar PV had become an unsustainable money-sapping villain.
Fast-forward to 2026 and Chinese solar panels prices retail in the $0.1-$0.2/Wp range and unsubsidised solar power has become one of the cheapest electricity sources on the planet together with onshore wind. And as we will see, this is just in time since the “electrification of everything” megatrend is creating huge demand pressure on the electricity grid, especially in the US.
The challenge – electrification of everything
The world is warming and a powerful solution lies in parallel actions to “electrify everything” while decarbonising electricity generation. The first part of this journey actually started centuries ago (thanks to clever physicists like Michael Faraday, Alessandro Volta, Nikola Tesla, and James Clerk Maxwell) while decarbonisation began in earnest in the 2010s and was given extra impetus by the Paris Agreement in 2015.
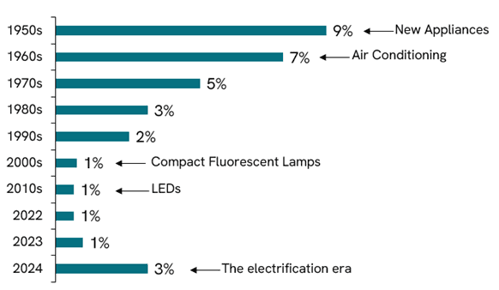
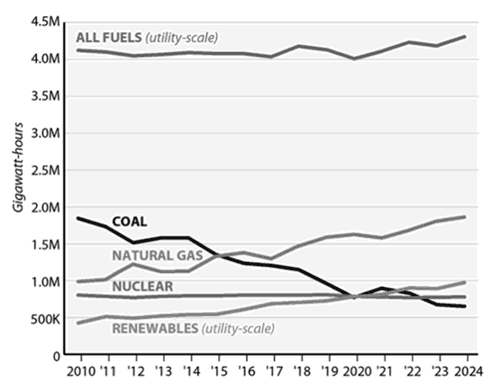
For the past few decades, continuous improvements in the energy efficiency of products resulted in an only very gentle rise in US grid load demand of around ~1% annually which was relatively easily covered. However, grid load growth has been accelerating in recent years and in 2024 we saw growth well above 1% (see figure 1).
Figure 1: Accelerated electrification generates increased electricity needs
This increase is not an outlier but just the first step to an acceleration in grid load demand growth that is expected to persist for years or even decades. The reason? Shorter term, we have the rapid expansion of AI and associated need of more data centres and processing power. But as the figure 2 shows, other megatrends are also expected to play an increasingly important role, such as:
- Replacement of gas/oil-powered heating systems with heat pumps.
- Increasing deployment of heating, ventilation and air conditioning (HVAC) especially in emerging economies where disposable income is rising and cooling needs are huge, underpenetrated and accelerating due to climate change.
- And above all the increased adoption of electric vehicles.
Integrated resource plans (IRPs) - essentially long term plans - from US electric utilities are also predicting progressively higher demand each year (see figure 2).
Figure 2: Electricity demand drivers and anticipated load growth upwards revisions
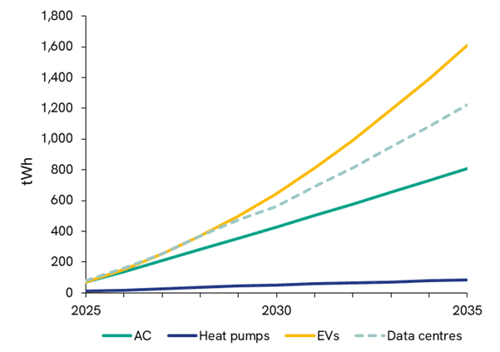
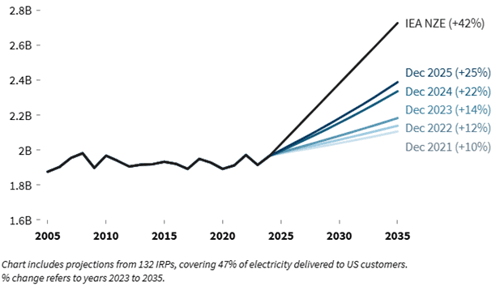
And we are only at an early innings on the electrification journey. According to the IEA World Energy Outlook 2025, electricity amounted to just ~21% of the world’s final energy consumption.⁵ Some segments are well advanced such as the electrification of lighting (95% complete) while global transport is still at only a single digit level of electrification.
As the above charts show, the electricity demand ‘crunch time’ has started and is expected to only get more intense in coming years. Electricity prices across the US have already been rising above historic inflation level6 which adds to the pressure.
The solution – look no further
Experts are very clear on the long-term solutions needed to move towards a carbon emission-free world. This is a system-level solution comprising a large amount of wind and solar combined with various short- and long-duration storage options (battery, green hydrogen, pumped hydro) as well as potentially (small scale) nuclear (SMR), bio-energy and CCS (Carbon Capture and Storage) to complement.⁷
But US peak power demand is forecast to rise by ~120GW over the coming five years⁸ and there are currently only single digit GW of non-renewable energy generation additions under constructions or in active planning.⁹ This means that by far the largest share of net additions has to come from renewable energy (wind/solar) – it is the only technology that can be rapidly deployed at scale as the figure below shows. Energy efficiency is also continuing to play a role here - both in reducing demand increase but also in providing ‘new’ sources of electricity from existing inefficient processes.
Figure 3: Expected deployment timelines by generation type¹⁰
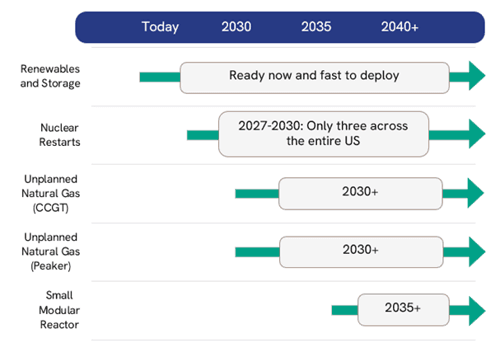
This is in fact a continuation of an already existing trend: in 2024, 92.5% of global total power capacity expansion came from renewable power sources!¹¹
In addition to speed of deployment, onshore wind and utility-scale solar are also the cheapest sources of new electricity generation on their own and will soon be the cheapest even when accounting for storage (see figure 4 below). This bodes very well for future growth of renewable energy deployment and makes us optimistic on the growth trajectory of utility-scale projects.
Figure 4: Levelised cost ranges for various energy sources (in US$ / MWh)¹²

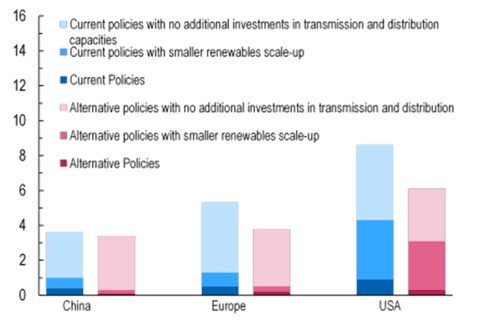
The positive impact of renewable energy on electricity prices has also been emphasised by recent analysis by the International Monetary Fund. In this analysis, the impact of rising electricity demand from data centres creates upwards price pressure but an accelerated deployment of renewable energy (red bars) abates this trend regardless of region.
Figure 5: Forecast change in electricity prices, 2030 (%)¹³
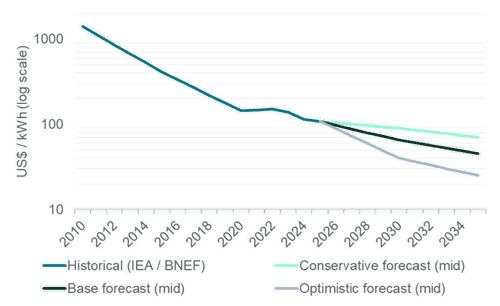
Not everything is plain sailing though. Solar/wind are intermittent energy sources and as their deployment rises, it creates risks to grid reliability. The solution is pairing intermittent renewables with battery storage. While this increases the cost, battery prices have been in rapid decline for more than a decade which means that a solar/battery system is already competitive with gas peaker power plants needed to cover spikes in electricity demand.¹⁴ As battery prices continue to fall, this technology is expected to replace new natural gas combined-cycle plants (see figure 6 below) since in many scenarios, a battery pack price in the $60-80/kWh would be the cheaper option.¹⁵
Figure 6: Battery pack prices (2010-2025) and forecast scenarios to 2035¹⁶
A final thought
What once was a tree-hugger’s idealistic dream has become a concrete reality. Today renewable energy is fully competitive with fossil fuel technologies and indeed is the only viable solution to the imminent load grid pressures from rapidly rising electricity demand. The WHEB strategy is well positioned to continue benefitting from this development with our holdings in First Solar, Nextpower, and Vestas.
When I initiated on the solar energy sector back in 2005, I chose the title “Rise of a new power generation”. The little toddler has grown into a fine adult.
¹ Grid Strategies
² International Energy Agency
³ Bloomberg New Energy Finance
⁴ https://rmi.org/the-state-of-utility-planning-2025-q4/
⁵ IEA World Energy Outlook 2025. https://www.iea.org/reports/world-energy-outlook-2025/executive-summary
⁶https://www.eia.gov/electricity/monthly/update/end-use.php
⁷ BNEF, IEA, IRENA, NREL, IPCC
⁸ https://www.reuters.com/business/energy/rising-us-industrial-load-intensifies-power-generation-need--reeii-2026-02-09
⁹ https://www.reuters.com/business/energy/developers-add-187-gw-natural-gas-fired-capacity-by-2028-eia-says-2025-06-11
¹⁰ NextEra Energy company information (4Q2024 presentation)
¹¹ https://www.irena.org/News/pressreleases/2025/Mar/Record-Breaking-Annual-Growth-in-Renewable-Power-Capacity
¹² Rystad Energy research and analysis
¹³ IMF
¹⁴ Bloomberg Green Daily from 27 January 2026
¹⁵ BNEF, Ember Energy, Lazard
¹⁶ IEA / BNEF for history. Scenarios sources: BNEF / GS (Conservative); McKinsey, Energy Transition Commission, ScienceDirect https://www.sciencedirect.com/science/article/pii/S0378775324021104 (base case); ScienceDirect above and https://www.sciencedirect.com/science/article/pii/S2352152X23031985 (optimistic)
Risk: The WHEB Environmental Impact Fund, the WHEB Sustainable Impact Fund and the FP WHEB Sustainability Impact Fund are Equity funds. Investors should be willing and able to assume the risks of equity investing. The value of an investment and the income from it can fall as well as rise as a result of market and currency movement; you may not get back the amount originally invested.
This is marketing communication. Please refer to the prospectus, supplement and KIID/KID for the funds, which contain full information on the risks and detailed information on their characteristics and objectives, before making any final investment decisions.
Disclaimer: This insight may provide information about Fund portfolios, including recent activity and performance and may contain facts relating to equity markets and our own interpretation. Any investment decision should take account of the subjectivity of the comments contained in this insight. This insight is provided for information only and all the information contained in it is believed to be reliable but may be inaccurate or incomplete; any opinions stated are honestly held at the time of writing but are not guaranteed. The contents of this insight should not therefore be relied upon. It should not be taken as a recommendation to make an investment in the Funds or to buy or sell individual securities, nor does it constitute an offer for sale.