

While 'quality' is one of the most widely used terms in equity investing, there is no universally accepted definition, even among index providers. At Guinness Global Investors, we define quality as a company’s ability to allocate capital effectively, which we identify through high return on capital and low leverage. In this insight, we use our PROVEN framework to explain why quality is more than a defensive play, but a durable source of long-term equity outperformance. The full report, including a quality universe breakdown and additional drawdown analysis, is available at the end of this article.
Investing in high-quality companies makes sense intuitively, and especially for the long term. But what is quality, and can it be objectively defined? For a quality investing approach to work repeatably – and we believe that it can – it needs a framework to identify quality companies and why they can outperform.
We define quality with reference to the fundamental drivers of equity returns. For us, it comes down to a company’s ability to allocate capital effectively over time. Having established the metrics that reflect this in reality, we can assemble the data and make an empirical case for quality as a durable source of long-term equity outperformance.
Our framework is based on PROVEN quality.
- PERSISTENT RETURNS
- REPEATED OUTCOMES
- OUTPERFORMANCE
- VALUE ASYMMETRY
- ENDURING GROWTH
- NAVIGATION OF MARKET STRESS
We find that rather than simply being ‘defensive’, quality companies sustain more durable growth, exhibit a higher frequency of positive corporate outcomes, and resultingly outperform lower-quality peers, being systematically mispriced by a market that underestimates the persistence of high returns on capital.
How do we define quality?
There is no single, universally accepted definition of a quality company. This subjectivity is evident even among widely used index providers. The MSCI Quality Index, for example, defines quality using a combination of return on equity, earnings volatility, and financial leverage. The S&P 500 Quality Index employs return on equity, accruals ratios, and financial leverage, while FTSE quality indices focus on return on assets, asset turnover, accruals, and leverage. This becomes even more subjective when it comes to actively managed investment strategies. Even where market participants agree on the variables to use, methodologies diverge in terms of time horizons, thresholds, and factor weightings.
Quality is more than profitability
Each commonly used return metric offers useful insight into business quality, but none is without limitations. Return on equity (ROE), while intuitive and widely used, is highly sensitive to a company’s financing mix and capital allocation decisions. Increased leverage or aggressive share buyback programmes can mechanically inflate ROE without any improvement in underlying business economics. Return on assets (ROA) improves on this by focusing more directly on operating efficiency and reducing the influence of capital structure, though it remains affected by accounting differences and asset intensity across industries. But better still, and our preferred metric, is return on capital (ROC).
Return on capital can be a powerful leading indicator
ROC is less distorted by leverage, more comparable across different capital structures and industries, and most directly connected to the mechanism through which businesses create lasting value: the sustained ability to earn returns that exceed the cost of the capital deployed.
As investors, we care more about the future than the past. It is great if a company has shown itself to be successful, but what we want to know is if that success is going to continue. While high return-based metrics can provide confidence in a company’s point‑in‑time quality, true quality is characterised by the ability to sustain and compound those returns over time. As shown below, return on capital exhibits the strongest persistence of future returns over subsequent years, compared to both ROA and ROE. ROC can therefore serve as a powerful leading indicator of long‑term value creation, reinforcing its relevance as a core quality signal.
Figure 1: Return on capital shows the strongest persistence of high returns over time
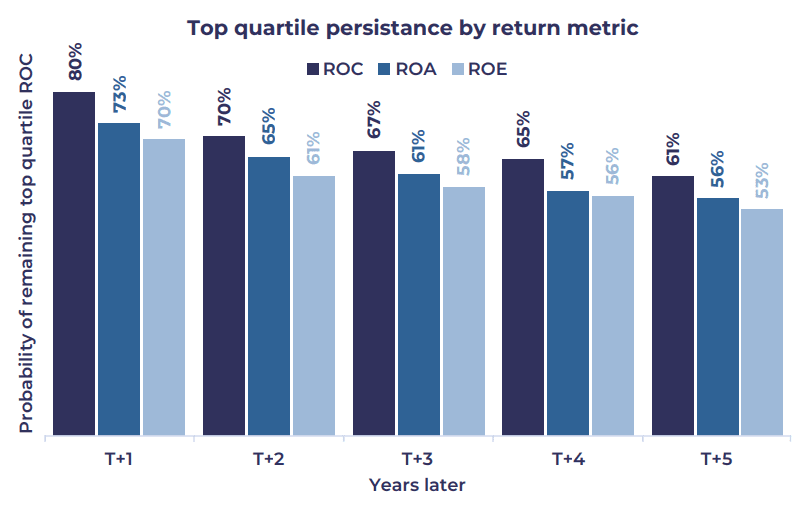
Source: FactSet, Guinness Global Investors. Data from 2000 – 2024. Universe is constructed using all developed market listed companies with market capitalisations greater than $1bn. Graph figures are medians over rolling T+1 to T+5 periods.
Considering leverage enhances ROC as an indicator
ROC alone, however, may not be sufficient: businesses that generate high returns but rely on excessive leverage can quickly unravel as cash flows are diverted to debt servicing or when balance sheet fragility is exposed during periods of economic stress. In such environments, previously stable cash flows may prove less reliable, constraining reinvestment and undermining long-term returns.
By pairing return on capital with low leverage, investors gain an additional margin of safety in the form of financial resilience. This combination enhances downside protection in weaker equity markets and can help maintain a disciplined focus on sustainable value creation. This is reflected in greater persistency of returns – low leverage companies are more likely to remain high quality than high leverage businesses.
Figure 2: Combining ROC with low leverage produces more persistent quality
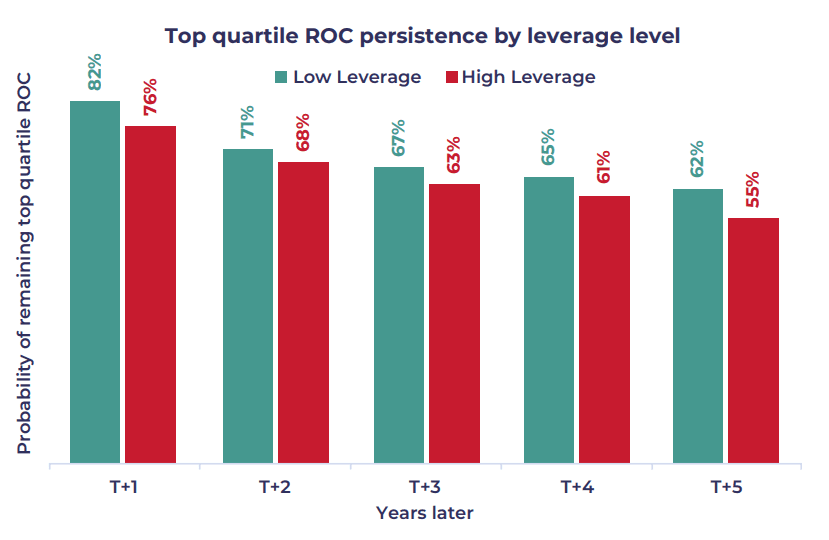
Source: FactSet, Guinness Global Investors. Data from 2000 – 2024. Universe is constructed using all developed market listed companies with market capitalisations greater than $1bn. Graph figures are medians over rolling T+1 to T+5 periods.
Our PROVEN framework
Persistent Returns
The persistency analysis below establishes the basis for the first pillar of our PROVEN quality framework: Persistent Returns.
As we extend the historic period over which we screen for top-quartile ROC, the persistency signal strengthens. Companies with one year of top-quartile ROC already show a strong probability of maintaining that status (as shown above); however, extending this to 10 consecutive prior years of top-quartile ROC raises those probabilities to 93%, 84% and 79%.
Figure 3: ROC persistency increases with longer track records of top-quartile ROC
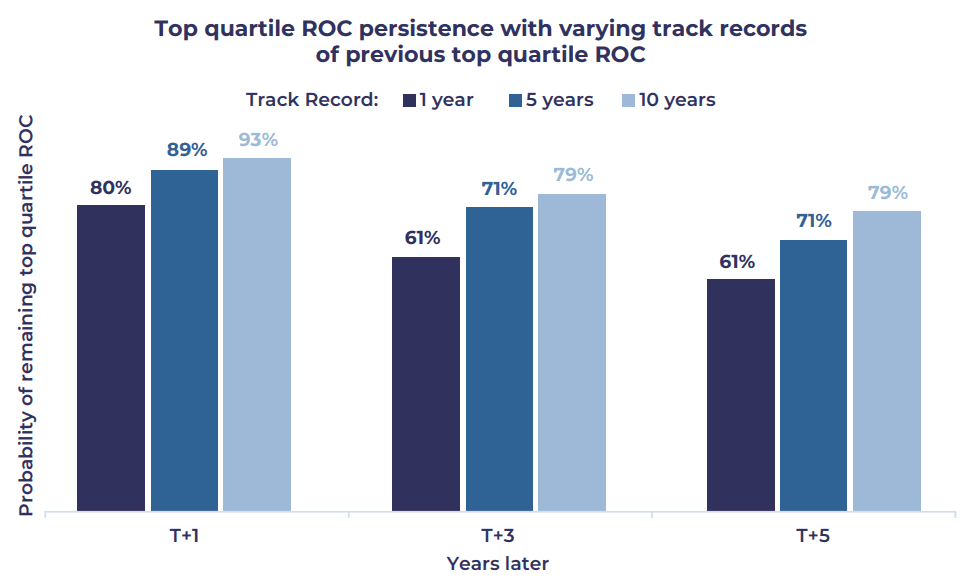
Source: FactSet, Guinness Global Investors. Data from 2000 - 2024 Universe is constructed using all developed market listed companies with market capitalisations greater than $1bn. Graph figures are medians over rolling T+1 to T+5 periods.
Put simply, companies with longer track records of high ROC are more likely to keep allocating capital well – or ‘good companies stay good’. We therefore favour longer records over shorter ones. In practice, the appropriate threshold depends on the investment strategy: more defensive strategies may seek extended histories of sustained top-quartile ROC, while quality growth strategies may apply a shorter screen to capture businesses earlier in their compounding lifecycle. The key definition of quality stays the same: high ROC with strong balance sheets.
Quality is more widespread that you think
Fortunately for investors looking to build diversified portfolios, our quality filter does not dramatically skew sectoral, regional or market cap exposures. While quality companies are relatively more frequently observed in less capital-intensive industries such as Information Technology, our definition of quality enables broad and diversified exposure across the global equity universe.
Quality sustains growth
The highest-growth businesses companies will require elevated levels of reinvestment and external financing, there is a subset of companies that expand quickly through disciplined capital allocation and sustained value creation. Indeed, our own ‘quality growth’ approach takes quality as a starting point instead of growth itself. Corporate growth rates show limited persistence over time and typically mean-revert, but we find that quality slows this decay. Even among slower-growing companies, quality helps future growth persist. In other words, high quality supports higher growth for longer.
Repeated Outcomes
The asymmetry shown below is the next pillar of our PROVEN quality framework: REPEATED OUTCOMES.
Quality companies produce more positive corporate outcomes than negative ones
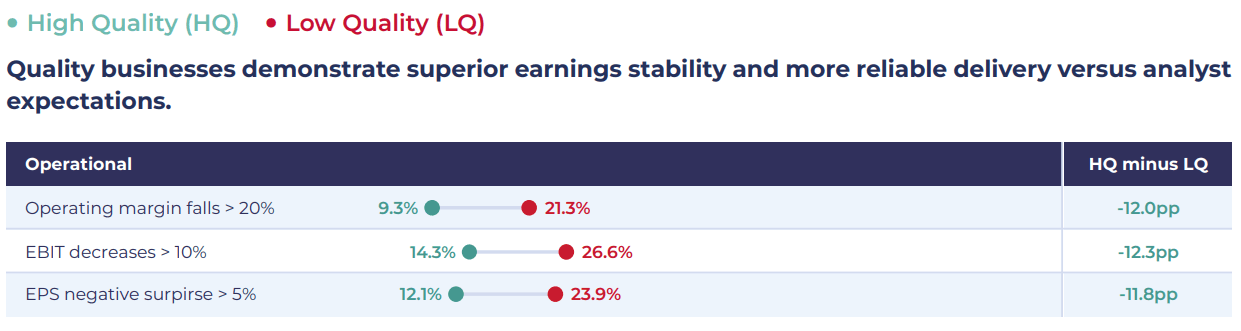
High-quality companies are less likely to exhibit negative operational outcomes thanks to their more resilient cash flow generation and superior pricing power. This leads a lower risk of sharp deterioration in fundamentals whether through contracting margins or growth that is volatile and less predictable.
Quality businesses are less likely to seek material additional external financing through share issuance or debt.

More predictable operational outcomes mean high-quality companies are more likely to avoid forced dilutive financing. They are less likely to issue shares or take on excessive debt to plug funding gaps - preserving optionality for management.
Quality companies are more likely to reinvest at higher rates in R&D and capital, sustaining long-run competitive advantage.

This combination of highly cash-generative business models, and low reliance on external financing, enables high-quality businesses to reinvest more reliably in future revenue-generating activities such as R&D and capital expenditure. That reinvestment creates a flywheel upon which those positive operational outcomes can keep occurring.
Quality companies are more likely to grow dividends consistently and return cash to shareholders; dividend cuts are rare.

Source: FactSet, Guinness Global Investors. Data from 1991 – 2025 based on an internally developed Global Developed Markets equity universe for any given year using the 85% market capitalisation coverage rule applied independently per country. Quality quartiles based on composite ROC and Debt/Equity z-scores.
High-quality firms subsequently exhibit a greater capacity to return capital to shareholders in a sustainable and growing manner, while retaining the flexibility to invest opportunistically. Strong balance sheets allow these companies to support dividends through the economic cycle, avoid forced dividend cuts or capital raising in periods of stress, and selectively reinvest when attractive opportunities arise.
Outperformance
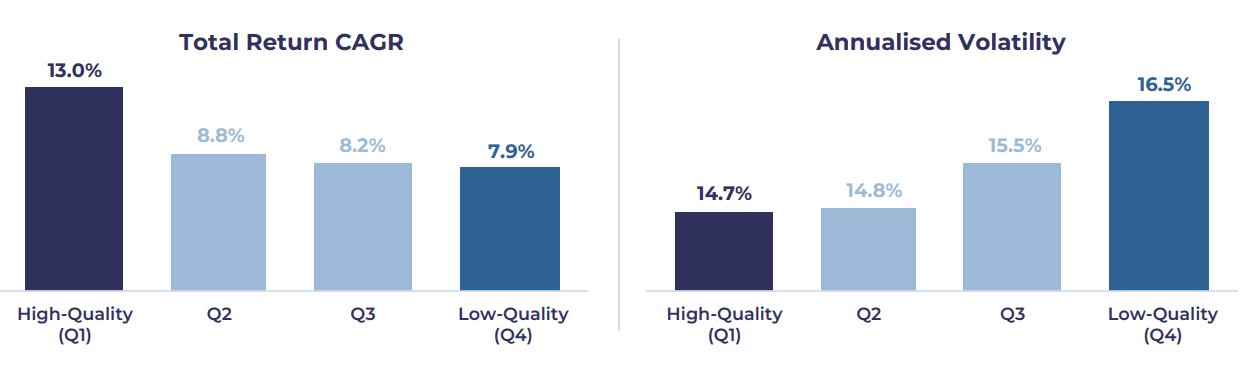
The third pillar of our PROVEN quality framework is perhaps the most important: Outperformance. To evaluate it, we construct four baskets of companies characterised by their level of ROC and leverage. Our analysis shows that from 1991 – 2025, high-quality businesses (Q1) produced a total return of 13.0% (annualised), compared to low-quality (Q4) businesses’ 7.9%. What’s more, they did so with lower levels of volatility, which led to superior risk-adjusted returns.
Figure 4: High-quality businesses outperform across return, and volatility metrics
Source: FactSet, Guinness Global Investors. Data from 1991 – 2025 based on an internally developed Global Developed Markets equity universe for any given year using the 85% market capitalisation coverage rule applied independently per country. Quality quartiles based on composite ROC and Debt/Equity z-scores. Returns in USD.
Understanding periods of quality underperformance
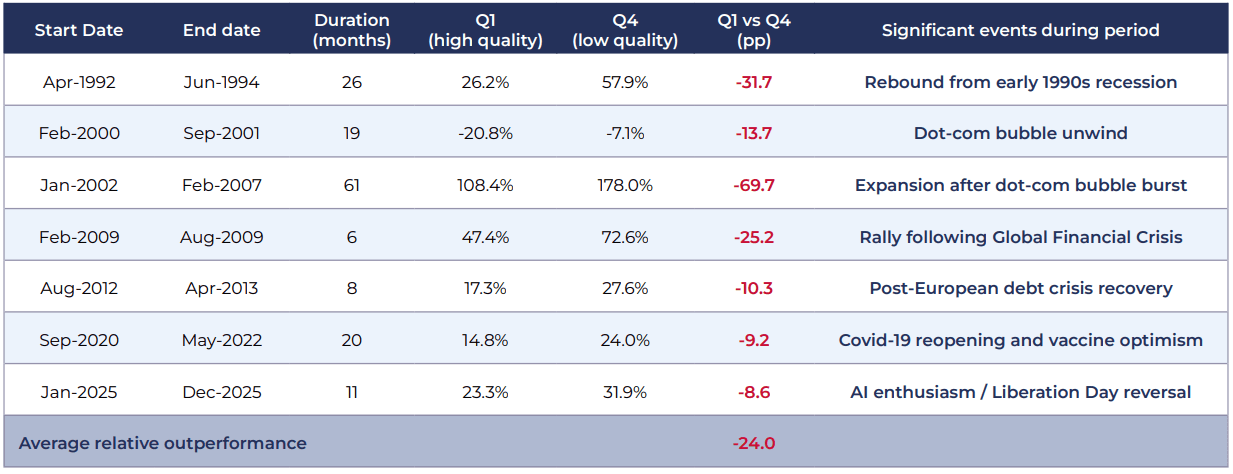
Despite the strong long-term outperformance of the quality factor, it is important to recognise that quality can underperform in certain periods and for us to be able to understand the drivers behind this. Fortunately, these periods are less common and overlap with some notable market episodes. Below, we highlight seven distinct periods in which investing in high-quality businesses did not work relative to a basket of low-quality businesses, and which major financial events coincided with them.
Figure 5: Periods in which Low Quality outperformed High Quality
Source: FactSet, Guinness Global Investors. Data from 1991 – 2025 based on an internally developed Global Developed Markets equity universe for any given year using the 85% market capitalisation coverage rule applied independently per country. Quality quartiles based on composite ROC and Debt/Equity z-scores. Periods defined where the low-quality universe outperformed the high-quality universe by at least 5pp in USD.
Upon closer inspection, these episodes have some common threads. All except the dot-com bubble unwind are characterised by recovery rallies following a market stress event, such as the European debt crisis. Commodity or real estate upswings are also challenging for the factor, as quality names are less commonly found in commoditised or regulated industries. For example, the lead up to the Global Financial Crisis was characterised by a booming housing market in the US and material credit expansion causing leveraged, cyclical companies to outperform. As markets rotated into the relevant industries, quality lagged on account of being less exposed to the sectors that relatively outperformed. In 2000/01, quality faced a significant headwind from its structural overweight to Technology (the worst-performing sector) as high-quality IT names that had seen large gains in the dot-com bubble had further to fall.
Overall, it is worth noting that quality still delivered a positive return in every one of these underperformance periods bar the dot-com unwind. The underperformance for investors in our basket of high-quality companies generally came in the form of missed upside rather than absolute losses.
Value Asymmetry
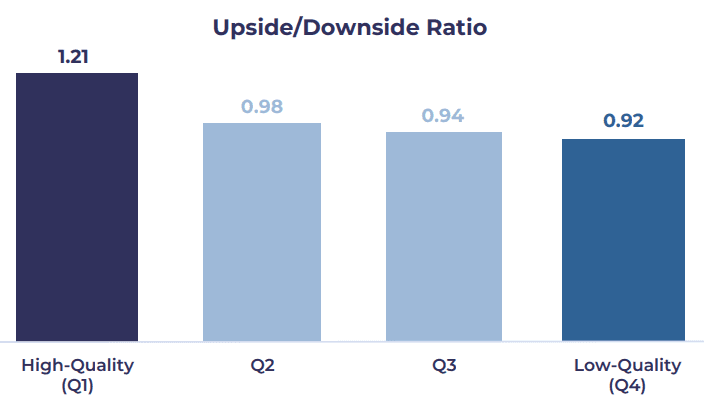
Crucially, quality is not merely defensive: high-quality companies still participate meaningfully in rising markets. While they may modestly lag lower-quality stocks during sharp, sentiment-driven rallies, their resilience in drawdowns tends to more than offset this. The result is a more favourable asymmetric return profile, with a wider gap between upside and downside capture than that typically observed in lower-quality businesses. Over time, this balance of participation and protection underpins superior compounding and is the next pillar of our PROVEN quality framework: VALUE ASYMMETRY.
Figure 6: Quality delivers an asymmetric return profile - more upside, less downside
Source: FactSet, Guinness Global Investors. Data from 1991 – 2025 based on an internally developed Global Developed Markets equity universe for any given year using the 85% market capitalisation coverage rule applied independently per country. Quality quartiles based on composite ROC and Debt/Equity z-scores.
Enduring Growth
The combination of superior growth persistence amongst high-quality businesses forms the ENDURING GROWTH pillar of the PROVEN quality framework.
As discussed earlier, overlaying quality onto growth produces more durable top-line expansion: high-quality growth businesses experience a slower fade in sales growth over time. That durability translates into superior returns. Since 2000, a portfolio of faster-than-average sales growers has delivered a 7.8% total return (annualised), but splitting that cohort by quality reveals a stark divergence. High-quality growth businesses (top quartile) generated a 10.7% return versus 6.8% for low-quality peers, alongside a materially higher Sharpe ratio (0.67 vs. 0.40) and a more favourable upside/downside capture (1.13 vs. 0.94). In short, growth alone is not enough - quality determines whether it compounds.
Navigation of Market Stress
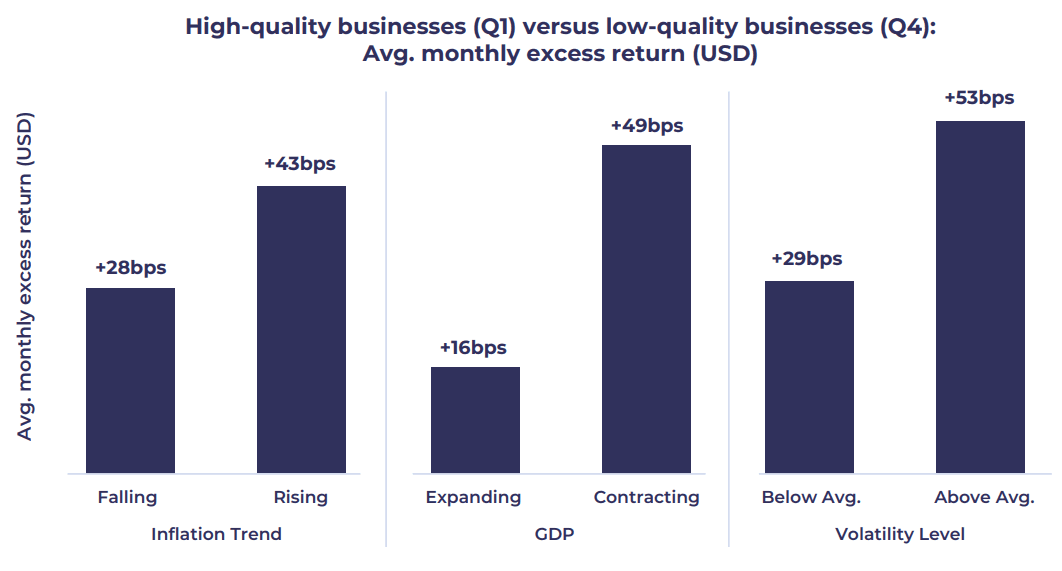
Extending this analysis to varying macroeconomic environments reinforces the picture. Quality's relative outperformance is strongest when economic conditions are least favourable: rising inflation, slowing GDP growth, and above-average market volatility. This reflects the resiliency of quality businesses not just to equity market movements, but to shifting macroeconomic conditions. This is the NAVIGATION OF MARKET STRESS pillar of the PROVEN quality framework.
Source: FactSet, Guinness Global Investors, OECD, CBOE. Data from 1999 – 2025 in USD on a monthly basis. Stocks are selected from our universe of the largest businesses in each year which make up 85% of global market capitalisation. Quartiles of quality are based on the average of ROC and Debt/Equity zscores. GDP trend is based on OECD G20 Composite Leading Indicator, Inflation is based on OECD G20 Inflation Index, whilst trend is based on current month CPI vs a 6month moving average.
Why Quality Matters
Taken together, the evidence is that quality businesses have historically delivered stronger long-run returns with better risk-adjusted characteristics, driven by more persistent fundamentals and a favourable asymmetry between upside and downside capture. Importantly, quality also improves the durability of growth, helping to distinguish businesses whose sales expansion can compound from those where growth fades.
These characteristics make up the PROVEN quality framework and underlie the philosophy we apply to several equity strategies: quality defensives, quality growth, quality mid-cap, and quality across global regions and sectors.
Quality Strategies at Guinness
Quality supports sustainable value creation and long-term dividend growth
Typically less ‘risky’ than their quality growth counterparts, Quality Defensives provide investors with greater security during periods of market volatility while still retaining meaningful upside participation when conditions are supportive. As highlighted earlier, high-quality businesses are more likely to pay sustainable and growing dividends.
This philosophy underpins the Guinness Equity Income range. Our objective is to construct portfolios of financially robust businesses capable of weathering economic uncertainty while still participating in market upside, delivering a more balanced and durable approach than traditional deep value or purely defensive income strategies. The aim is to provide investors with both long-term capital growth and a dependable, growing income stream.
Quality helps to avoid a key pitfall of growth investing
High-quality growth businesses exhibit a materially slower decay in sales growth rates over time, and this translates directly into superior long-term returns. One of the main difficulties in growth investing is that past growth is a poor predictor of future success. By starting with quality – high returns on capital and low leverage – we gain confidence that companies have the financial strength and competitive positioning to compound durable sales growth into sustainable cash flows and to reinvest effectively.
This forms the foundation of the Guinness Quality Growth range: providing exposure to structural growth themes through portfolios of high-quality businesses while avoiding excessive downside risk.
Read the full paper
Download Why Quality Matters in full, with additional backtesting and data on the distribution of quality companies, their growth and risk profile, and their performance in market drawdowns.
Risk: The Guinness Global Equity Income Fund, the WS Guinness Global Equity Income Fund, the Guinness Global Innovators Fund and the WS Guinness Global Innovators Fund are Equity funds. Investors should be willing and able to assume the risks of equity investing. The value of an investment and the income from it can fall as well as rise as a result of market and currency movement; you may not get back the amount originally invested. The Funds are actively managed with the MSCI World used as a comparator benchmark only.
This is marketing communication. Please refer to the prospectus, supplement and KIID/KID for the funds, which contain full information on the risks and detailed information on their characteristics and objectives, before making any final investment decisions.
Disclaimer: This insight may provide information about Fund portfolios, including recent activity and performance and may contain facts relating to equity markets and our own interpretation. Any investment decision should take account of the subjectivity of the comments contained in this insight. This insight is provided for information only and all the information contained in it is believed to be reliable but may be inaccurate or incomplete; any opinions stated are honestly held at the time of writing but are not guaranteed. The contents of this insight should not therefore be relied upon. It should not be taken as a recommendation to make an investment in the Funds or to buy or sell individual securities, nor does it constitute an offer for sale.