Growth
Beyond Hyperscalers: Mid-Cap Opportunities in Data Centre Investment
By Joseph Stephens and Sagar Thanki
Rather than having to justify huge spending on AI infrastructure, the ‘picks and shovels’ companies supplying the hyperscalers are already benefitting from it
Analysts are, on average, poor forecasters of the medium term. Looking back across almost two decades of MSCI World earnings estimates, the pattern is remarkably consistent: whatever the market expects EPS to be two years out, it is normally revised down from there, by roughly 10% on average, as reality falls short of the initial, optimistic forecast.
Against that backdrop, the current earnings cycle stands out as a genuine outlier. Estimates for 2026 and, even more strikingly, 2027 have done the opposite of the historical norm: they have been revised consistently upward since the start of the prior calendar year, tracking well above even the top decile of the last 18 years of outcomes.
MSCI World Index EPS Revisions since the start of the prior calendar year
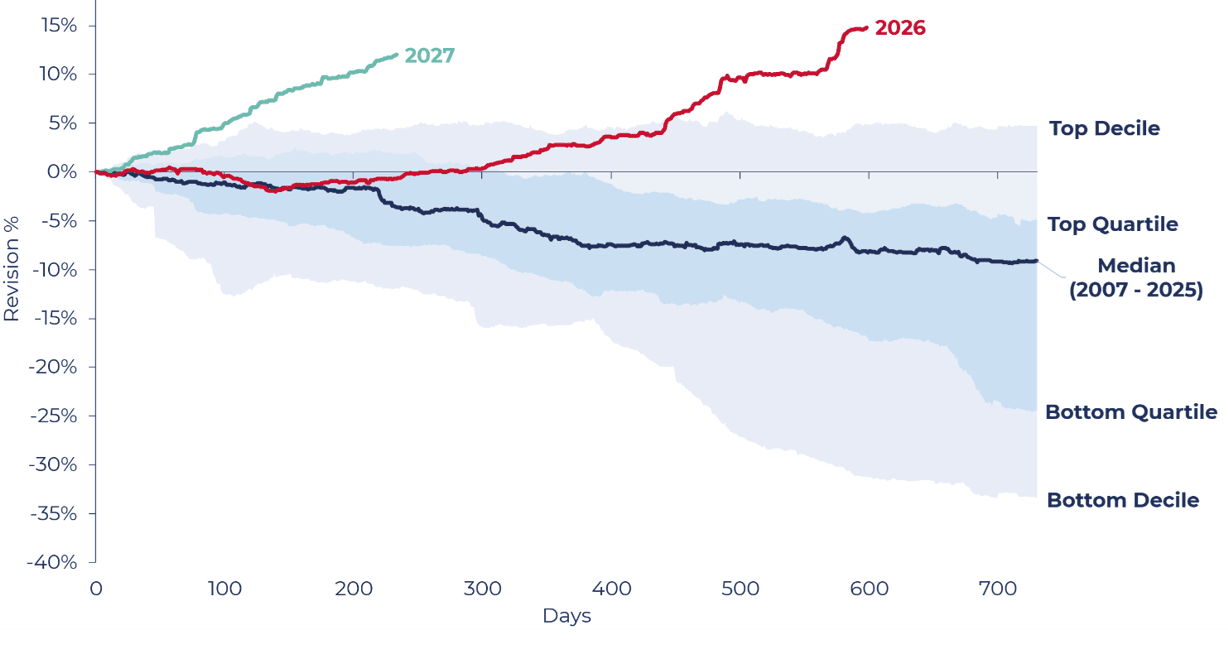
Figure 1: MSCI World EPS revisions since the start of the prior calendar year. 2026 and 2027 estimate paths sit above the top decile of the 2007-2025 distribution. Data as of 31.08.2026
That gap from the historical pattern is worth explaining. In this case, the answer is fairly narrow: a single, enormous source of incremental spending that is flowing through into the earnings of a specific set of companies.
What has caused this change from previous years?
That source is capital expenditure by the hyperscalers - and, increasingly, by a widening circle of “neocloud” and vertically integrated players. The scale of the build-out is difficult to overstate.
Aggregate capex across the five major hyperscalers - Amazon, Alphabet, Microsoft, Meta and Oracle - is estimated to have grown from around $416bn in 2025 to roughly $1.2 trillion by 2028, very close to a tripling in three years.
Hyperscaler Cumulative CapEx (2019-2028e)
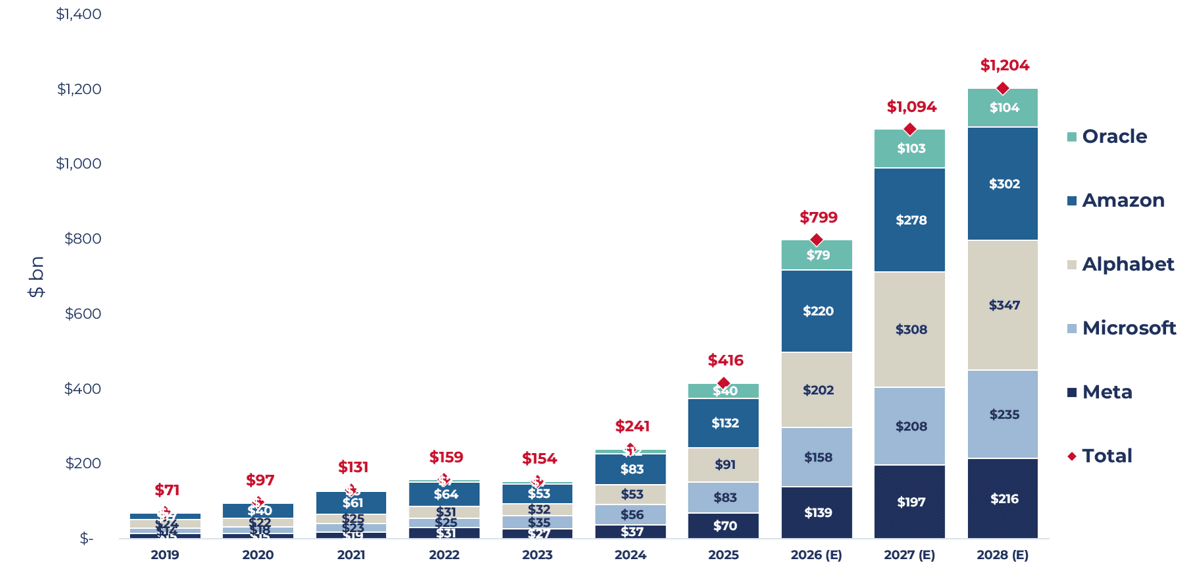
Figure 2: Hyperscaler cumulative capex, 2019A-2028E. Aggregate spend is estimated to approach $1.2trn by 2028. Data as of 31.08.2026
From capital light to capital heavy
That level of spending is reshaping the hyperscalers themselves. Businesses that investors have long prized precisely because they were capital-light - software and platform models throwing off enormous free cash flow - have, in the space of two or three years, become some of the most capital-intensive businesses in the market.
Aggregate quarterly free cash flow across the five hyperscalers had climbed almost every year since 2009, but is now estimated to turn negative from the second half of 2026 through 2028. Whilst analysts expect this to be the trough before recovering to new highs by 2029, it does rely on data centre and AI monetisation catching up with the build-out.
The US Hyperscalers' Quarterly FCF
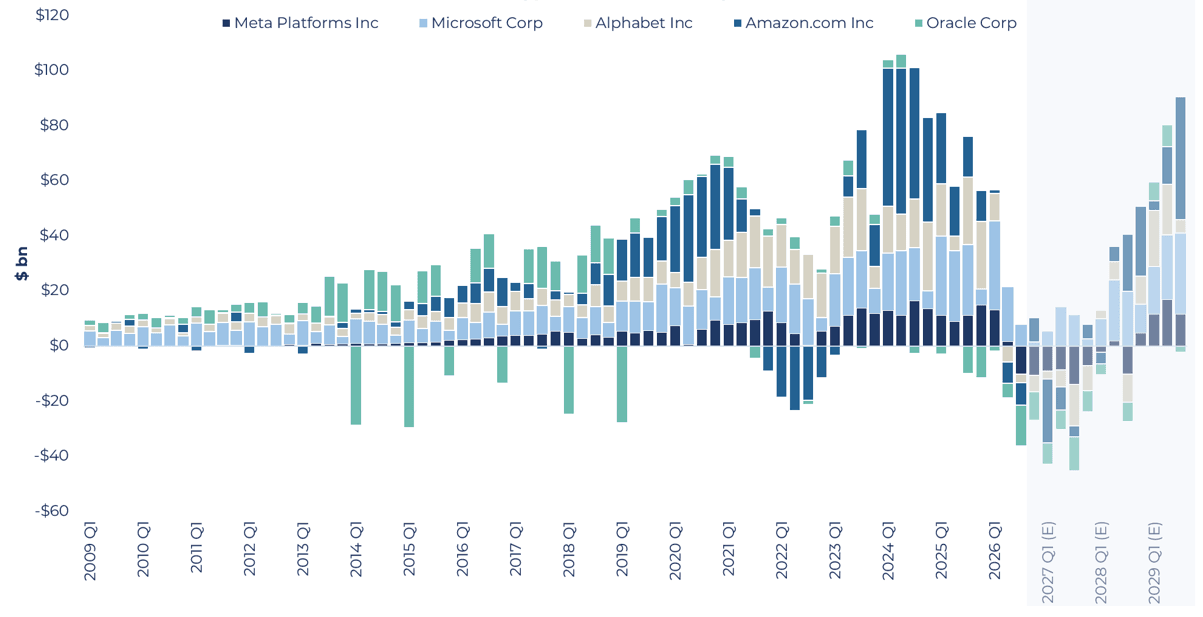
Figure 3: US hyperscaler quarterly free cash flow, 2009-2029E. Consensus points to a two-to-three year FCF trough before a recovery to new highs by 2029. Data as of 31.08.2026
Hyperscaler data centre investment has caused this
Most of that money ends up with the businesses that actually build the data centre - the picks and shovels of this cycle. That spans a wide chain of suppliers, from the semiconductor capital equipment and networking names at the leading edge, through to the industrial capital goods businesses providing the power and cooling infrastructure that turns a building full of chips into a functioning data centre.
Breaking down how each dollar of data centre capex is spent shows how broadly it is distributed. Semiconductors are comfortably the largest single line at around half of total spend - and within that line, spend is itself heavily concentrated in a handful of accelerator franchises, Nvidia foremost among them - with the remaining half spread across power infrastructure at roughly 20% of the total, networking equipment at 15%, facilities and construction at 8%, and cooling at 7%.
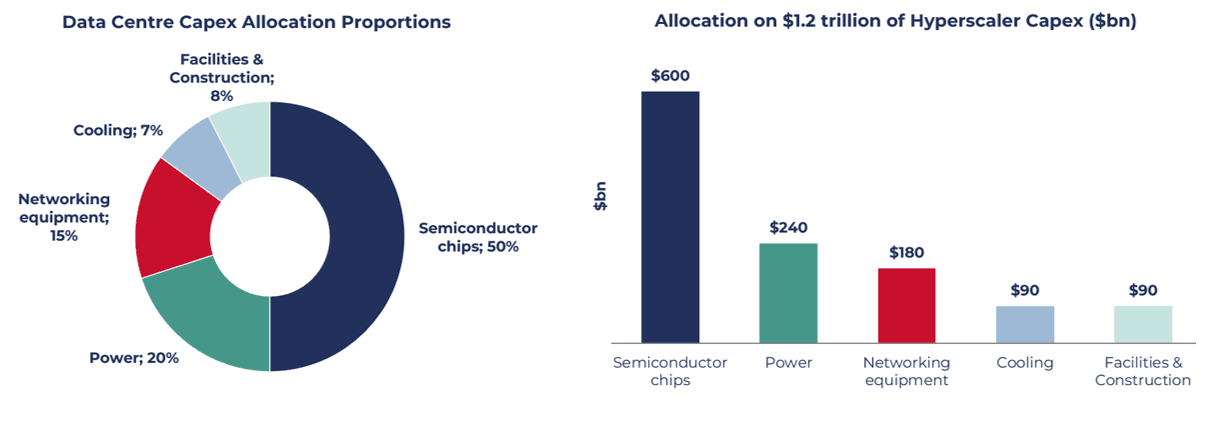
Figure 4: Estimated allocation of data centre capex by segment, and the implied annual spend on each line applied to $1.2trn of hyperscaler capex. Data as of 31.08.2026 from BNP Paribas Equity Research
The scale of the total matters here as much as the percentages themselves. Applied to the roughly $1.2trn of annual hyperscaler capex the market is building towards (Figure 2), every line translates into very large absolute numbers: semiconductors at roughly $600bn of annual spend, power infrastructure around $240bn, networking equipment roughly $180bn, and around $90bn each for cooling and for facilities and construction - every one of them comparable in scale to a substantial industry in its own right.
Each of those lines then fragments again into sub-segments of its own: within power, across medium-voltage switchgear, transformers, UPS systems, busbar and rack-level distribution; within cooling, across chillers, coolant distribution units, cold plates and the liquid loops that connect them; within semiconductors, across logic, memory, test, materials and packaging.
Any single one of those niches takes only a small percentage of the capex dollar - but one percentage point of $1.2trn is $12bn of annual spend, enough to support specialist suppliers of real scale.
The evidence is already in the numbers
This is not just a conceptual map of the value chain; it is already visible in reported and estimated financials. What 12-month rolling forward free cash flow estimates capture is the sheer scale of the cash transfer now under way. Money that until recently accumulated on hyperscaler balance sheets is being converted into equipment orders, and it is being transferred into the hands of their suppliers.
For the semiconductor companies on the receiving end, the result is record profitability: forward free cash flow estimates for the group have inflected to the highest levels on record in the space of barely two years, and consensus expects them to keep climbing.
12 month rolling forward FCF estimates for hyperscalers vs semiconductor companies
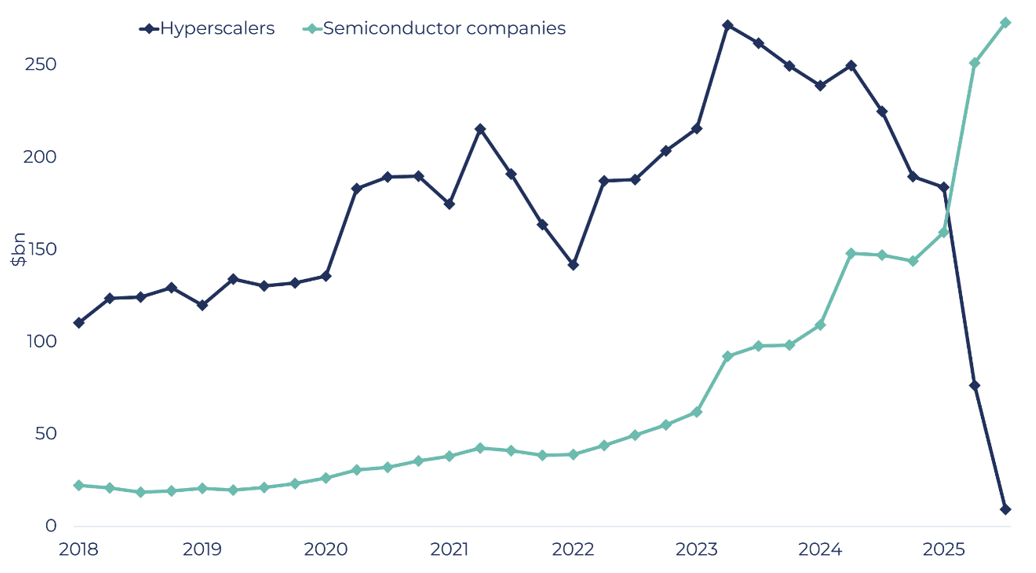
Figure 5: 12-month rolling forward free cash flow estimates, hyperscalers vs. semiconductor companies. Hyperscaler estimates roll over as the build-out consumes cash; supplier estimates inflect higher. Data as of 31.08.2026
The same inflection is visible in the industrial capital goods names supplying the electrical infrastructure, power and cooling systems - and increasingly the adjacent software - that data centres depend on.
Order intake across this group is accelerating rather than merely holding up: year-on-year backlog order growth troughed at 5.5% in the first quarter of 2025 and has risen in every quarter since, reaching 15.1% by the third quarter of 2026.
Quarterly backing order growth year-on-year
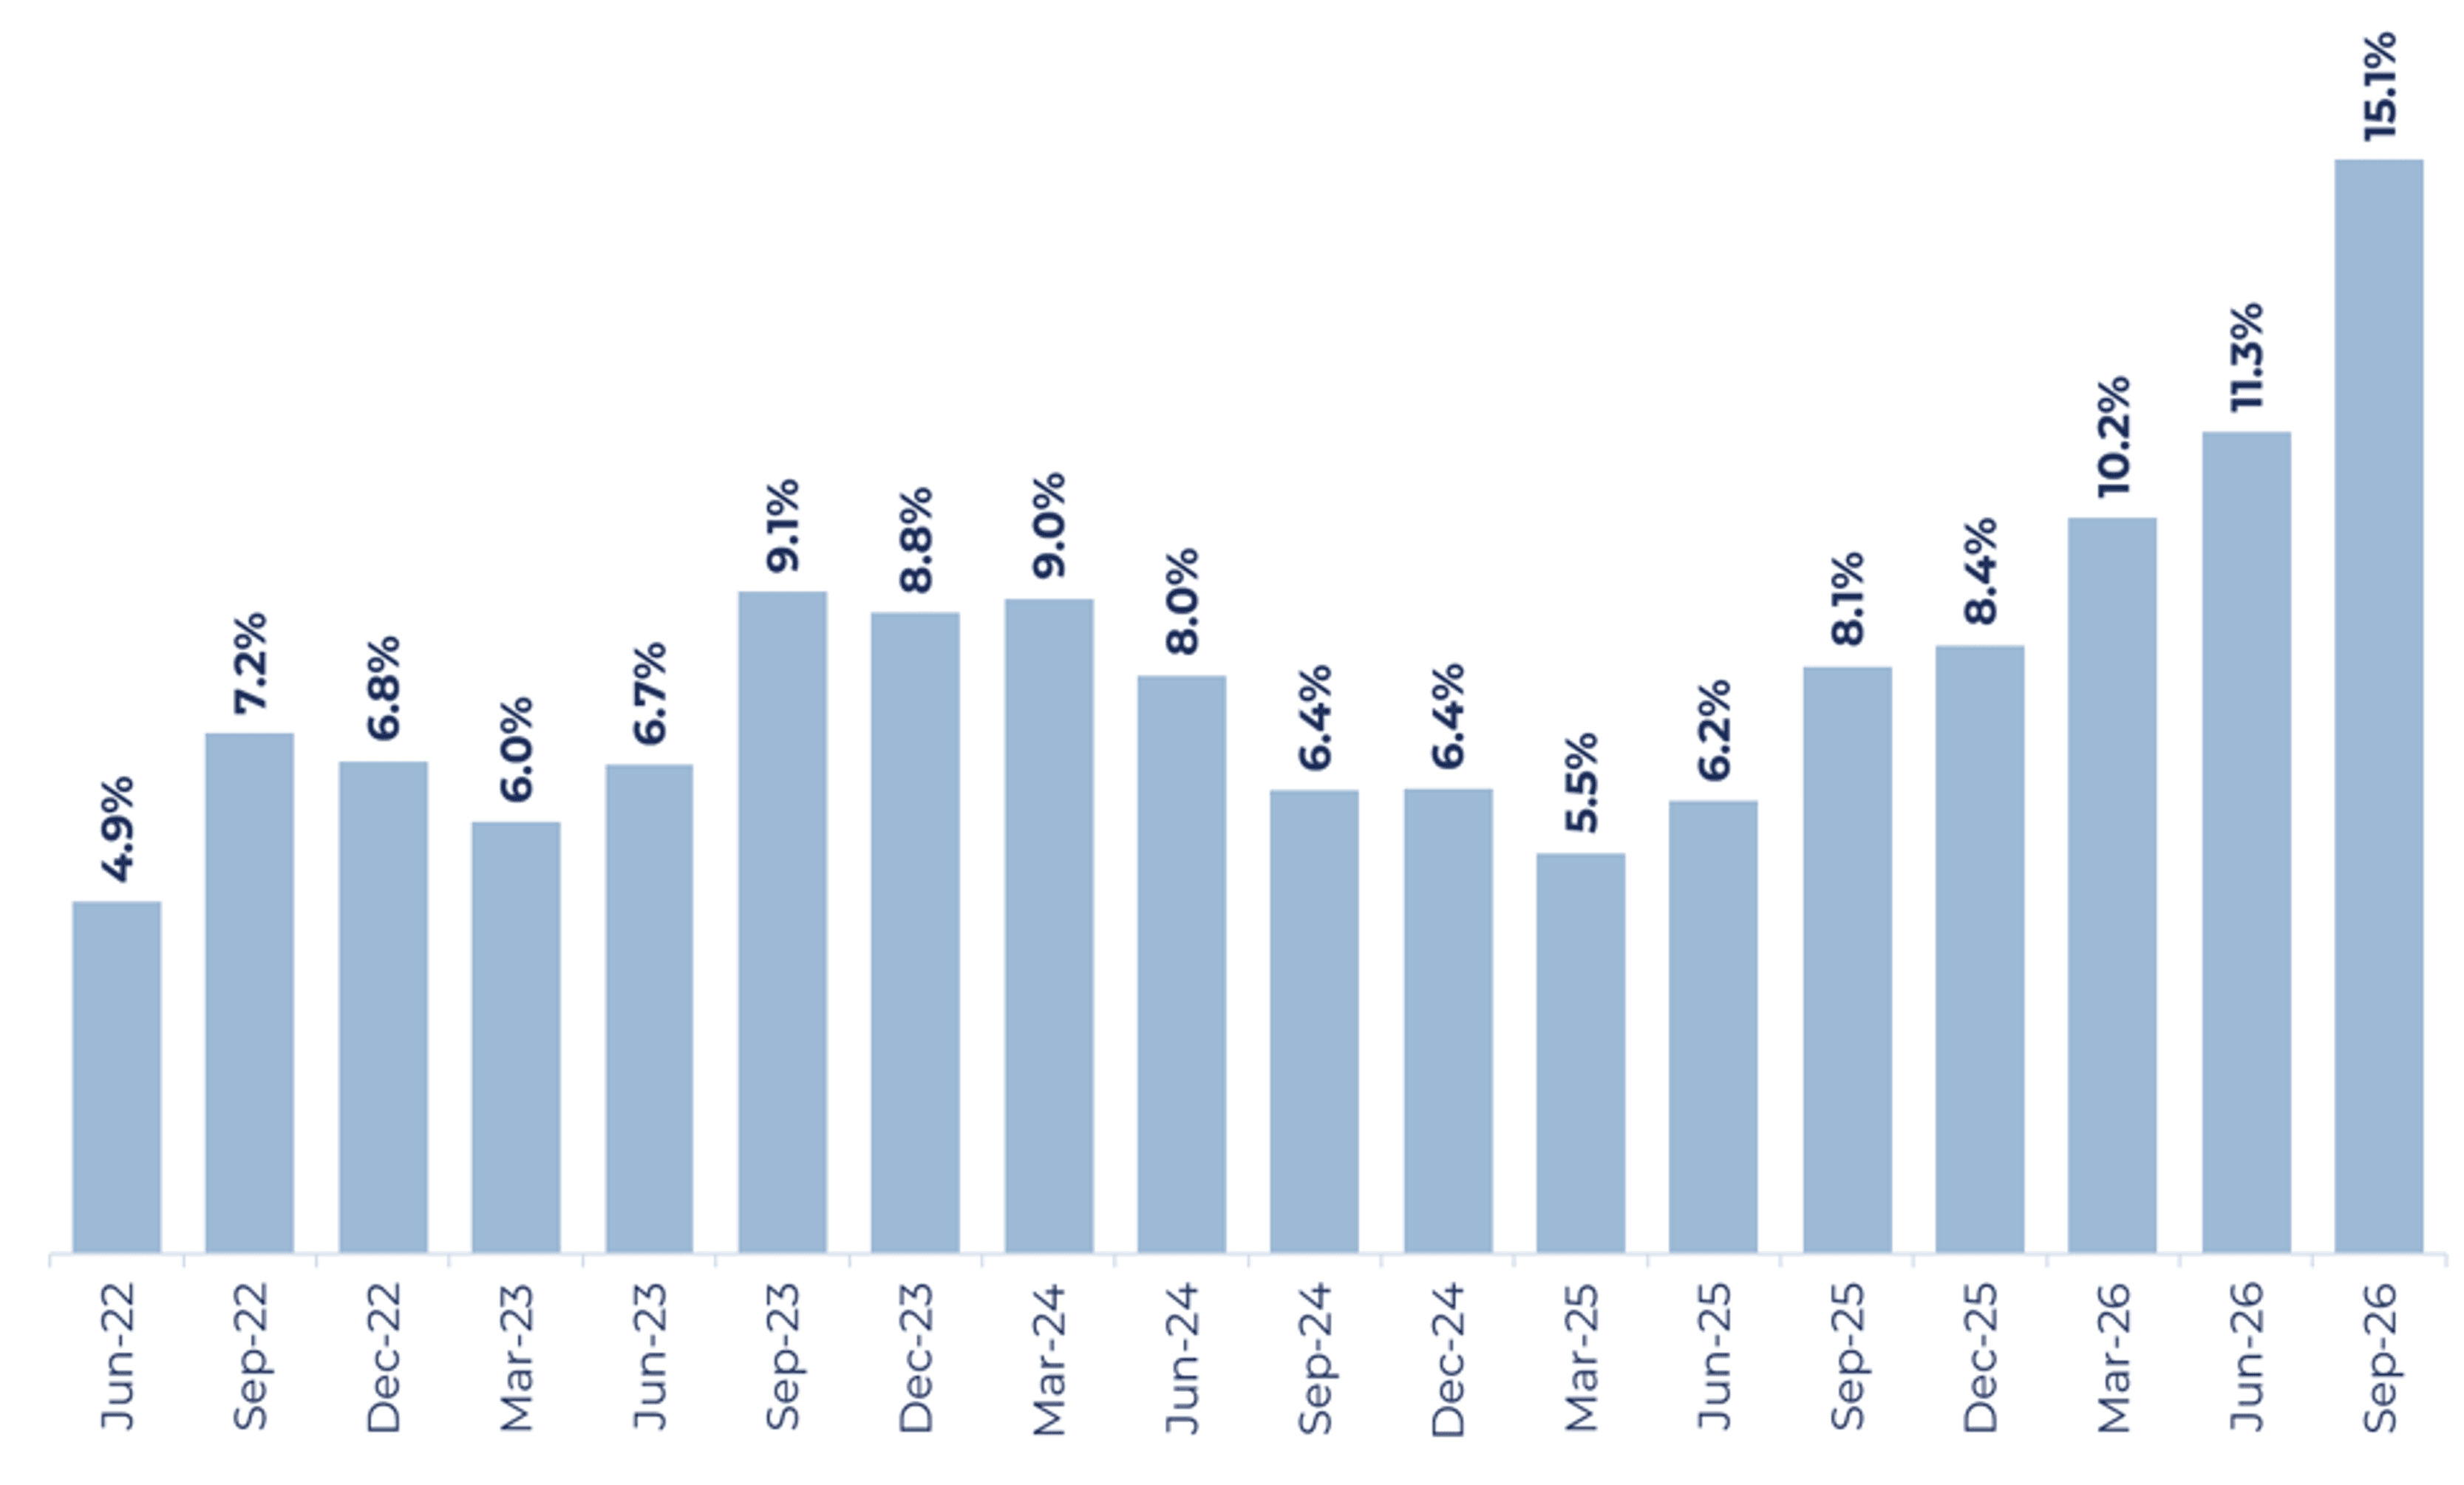
Figure 6: Quarterly year-on-year backlog order growth, capital goods companies, Jun-22 to Sep-26
Backlogs have been growing faster than the top line for several years now, highlighting the accelerating demand profile these companies are experiencing. The ratio of the two has subsequently climbed ever higher - average backlog cover has increased from 28% of the prior year's sales in 2018 to 72% in 2025, giving these businesses much greater visibility into future sales.
Just as importantly, this is not a long-dated order book: the majority of these backlogs is scheduled to convert into revenue within one to two years, which makes the visibility near-term and concrete.
Average backlog value as a proportion last fiscal year sales
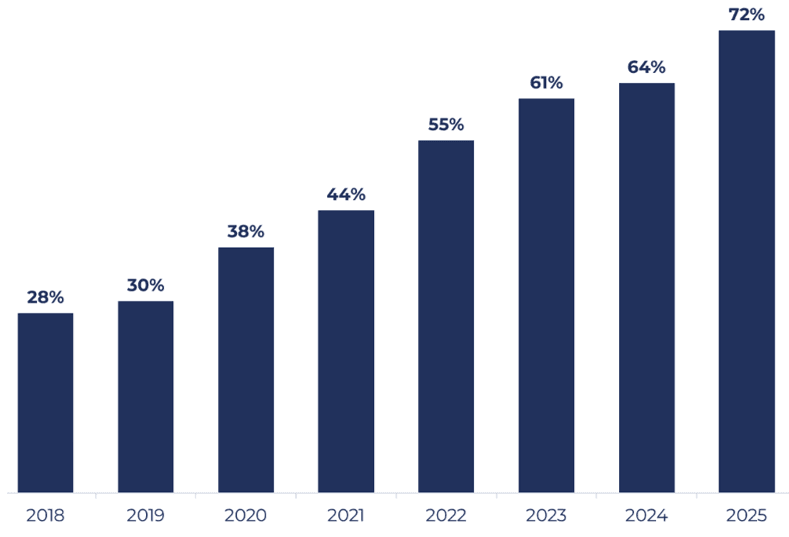
Figure 7: Average backlog value as a proportion of prior fiscal year sales, capital goods companies, 2018-2025
An opportunity arises for mid cap stocks
The natural instinct for many investors looking to play the data centre build-out is to buy the businesses everyone already knows: the mega-cap semiconductor equipment names, or the hyperscalers themselves.
But the businesses most exposed to the incremental economics of this capex waterfall are not always the largest and are often found further down the market cap spectrum - which is precisely where the Guinness Global Quality Mid Cap Fund is designed to look.
The arithmetic of the capex breakdown explains why.
A category worth only a few percent of each dollar spent still becomes tens of billions a year against an annual budget approaching $1.2trn, and that money is already landing rather than merely being forecast: order books across the power, cooling, electrification and networking suppliers have inflected sharply (Figures 6 and 7) despite none of those categories sitting near the largest line in the breakdown.
The same holds inside the largest segment: within semiconductors, some of the sharpest growth inflections are in far smaller sub-industries such as test and advanced packaging. What matters from there is the size of that flow relative to the business receiving it. A $20-30bn revenue pool barely moves a mega-cap's growth rate; against a mid cap turning over a few billion, with a tighter product focus and more operating leverage as volumes scale, the same pool resets the growth profile entirely. That is why, as bottlenecks emerge in narrower niches, the specialised suppliers tend to benefit disproportionately, before being bid up and graduating into large cap status themselves.
This is the segment the Fund is built to fish in: businesses past early-stage disruption risk but not yet large-cap holdings, where businesses have ample future growth runways alongside good and improving quality characteristics. It is equally a discipline for avoiding speculative small caps geared to a hot theme with no record of capital discipline, and crowded, fully covered mega-cap businesses. Sitting deliberately in the middle is, in our view, an attractive risk-adjusted way to play this theme. We set out three specific mid cap examples below.
Mid cap stock examples
The framework above is easier to make concrete with names. Across the electrification, power and networking value chains behind the data centre build-out, we would highlight three large cap holdings most investors likely already own - and, alongside each, a less widely-owned mid cap alternative arguably capturing just as much of the same structural demand, from a smaller, more focused base.
Legrand vs. Schneider Electric

Schneider Electric is the large cap default in electrification: a diversified platform spanning residential, commercial, industrial, grid and data centre customers, hardware and software alike. Its data centre franchise is anchored at the front of the building - medium-voltage switchgear, transformers, large UPS systems and the software that manages them. Legrand is narrower by design, and its content sits in the “white space” where the racks actually stand: overhead busbar and power distribution, rack-level PDUs and metered power strips, structured copper and fibre cabling, cable management and containment, and the environmental monitoring and close-coupled cooling hardware that sits in the row alongside the servers.
That distinction matters because the hard engineering has moved closer to the servers. A rack that once drew a few kilowatts can now draw tens of kilowatts, and getting that much power into a single cabinet - and the resulting heat back out of it - is no longer a routine cabling job. Every watt has to be carried, divided, measured, monitored and cooled in the last few metres before it reaches the chip, and the equipment that does that work is worth more per rack with each new generation of server.
Monolithic Power Systems vs. Texas Instruments

Texas Instruments is the dominant supplier of analog chips - the devices that convert real-world signals like power, temperature and sound into a form electronics can use - sold across automotive, industrial, personal electronics and communications as well as data centres.
Monolithic Power Systems is far narrower: a fabless designer of power management silicon, and specifically of the controllers and power modules that sit on the accelerator board itself and step voltage down to the fraction of a volt a GPU core runs at. That content is now extending outward into the rack, including the 800-volt DC architectures next-generation data centres are moving toward.
Power delivery has become a physical design problem as each accelerator generation of chip draws more current at a lower voltage, so conversion has to sit closer to - and increasingly underneath - the chip itself, because the losses in the last few centimetres of copper are no longer tolerable. Monolithic Power Systems' products are designed into that socket, so its content grows with the power envelope of each new chip.
Data centre investment doesn’t need to be hyperscalers
These two examples show how ‘following the money’ behind the AI infrastructure build-out can lead an investor beyond the hyperscalers, to which they will undoubtedly already hold, but still be exposed to the core of the data centre itself.
What’s more, this doesn’t mean unproven small-cap companies, but focused mid-cap specialists for whom the hyperscalers’ massive AI capex is already translating into earnings growth.
Our Global Quality Mid Cap Fund aims to invest in mid cap stocks that are benefitting from the data centre build out, as well as in other sectors using the same approach. Learn more here
Risk: The Guinness Global Quality Mid Cap Fund and the WS Guinness Global Quality Mid Cap Fund are Equity funds. Investors should be willing and able to assume the risks of equity investing. The value of an investment and the income from it can fall as well as rise as a result of market and currency movement; you may not get back the amount originally invested. The Funds are actively managed with the MSCI World Mid Cap used as a comparator benchmark only.
This is marketing communication. Please refer to the prospectus, supplement and KIID/KID for the funds, which contain full information on the risks and detailed information on their characteristics and objectives, before making any final investment decisions.
Disclaimer: This insight may provide information about Fund portfolios, including recent activity and performance and may contain facts relating to equity markets and our own interpretation. Any investment decision should take account of the subjectivity of the comments contained in this insight. This insight is provided for information only and all the information contained in it is believed to be reliable but may be inaccurate or incomplete; any opinions stated are honestly held at the time of writing but are not guaranteed. The contents of this insight should not therefore be relied upon. It should not be taken as a recommendation to make an investment in the Funds or to buy or sell individual securities, nor does it constitute an offer for sale.