
Real Assets
Investing in the Next Phase of US Renewable Power Growth
By Louis Bromfield
The US electricity market is being shaped by powerful but sometimes opposing forces. How are investors responding, and where does the Global Real Infrastructure Fund find opportunities?
For much of the past two decades, the US electricity market offered investors a relatively predictable backdrop. Electricity consumption was broadly flat, utilities focused on replacing ageing assets, and renewable investment was driven largely by state policy, federal support, and falling technology costs.
That environment is now changing. Electricity demand is growing again, new power generation is desperately needed, and the infrastructure required to move power around the system is struggling to keep pace. At the same time however, policy uncertainty and financing constraints are necessitating a more selective approach toward renewable energy investment.
In this more volatile environment, capital availability alone is no longer enough. We believe that the winners from the next phase of US power growth will be companies that combine available capital with development expertise, attractive regional positioning, and the ability to build and operate infrastructure across an increasingly complex electricity system.
America's electricity demand is growing
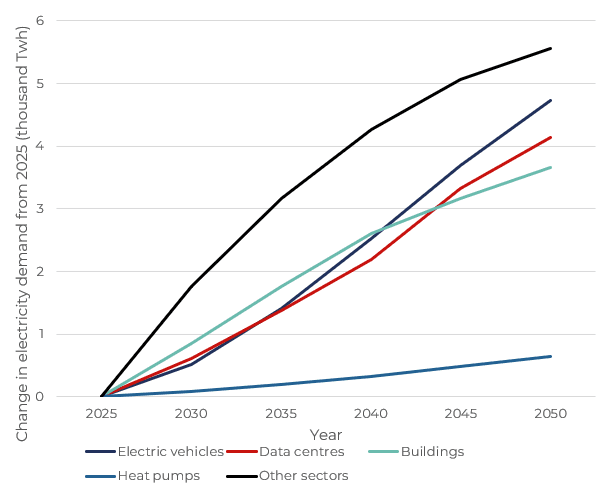
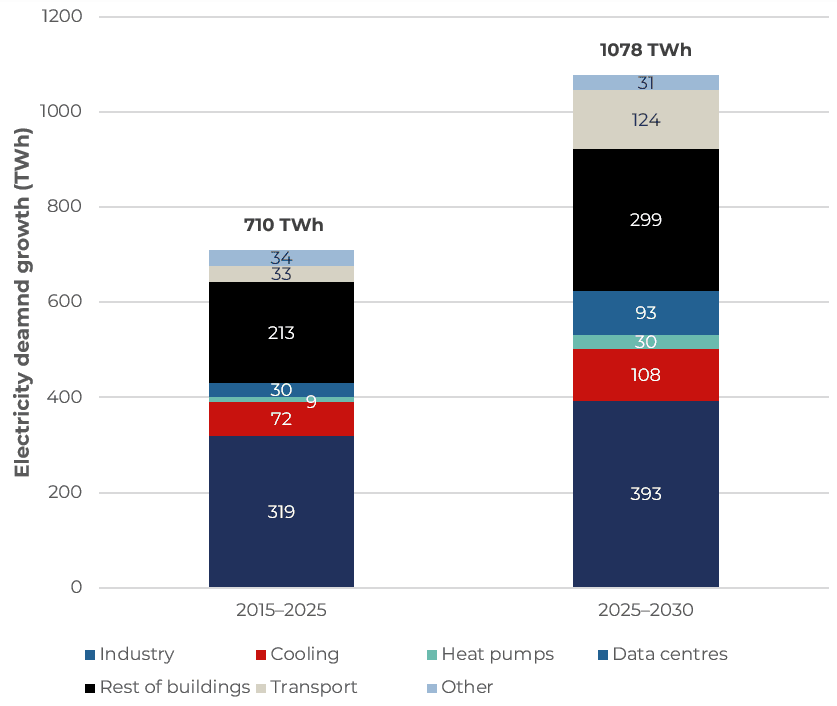
After 15 years of broadly flat consumption, US electricity demand increased by an average of 2.1% per year over the five years to 2025. In particular, the surge of AI usage is turning US data centres into giant energy consumers with electricity demand from AI training and services set to quadruple within a decade. By 2035, data centres could account for about 8.6% of US electricity demand. [AI Data Centers Fuel Quicker Growth In Power Demand].
However, US electricity demand growth is being driven by multiple concurrent trends. While AI will accelerate consumption, broad industrial electrification, domestic manufacturing re-shoring, and widespread adoption of EVs and heat pumps all mean that electricity will continue growing through 2050. [Annual Energy Outlook 2026].
Meeting this energy demand growth will therefore require significant additional generation, storage, transmission and distribution infrastructure.
Figure 1: Drivers of future global electricity demand, net change from 2025: Whilst driven by data centre growth, global energy demand growth has multiple concurrent drivers.
Source: BloombergNEF, 2026a, US Clean Energy Market Outlook 1H 2026: Forces at Odds, 18 May 2026
Figure 2: US electricity demand has returned to growth: After a prolonged period of subdued consumption, US electricity demand is growing again.
Source: U.S. Energy Information Administration, 2026 Annual Energy Outlook 2026, April 2026
Clean-energy growth continues, but under greater pressure
The return of electricity-demand growth is however occurring alongside a less supportive environment for US renewable development.
Federal policy uncertainty, changes to tax-credit availability, higher equipment costs, permitting delays and grid-connection constraints are placing pressure on project economics. These factors have reduced the viability of some marginal projects and lowered long-term deployment expectations from the levels anticipated several years ago.
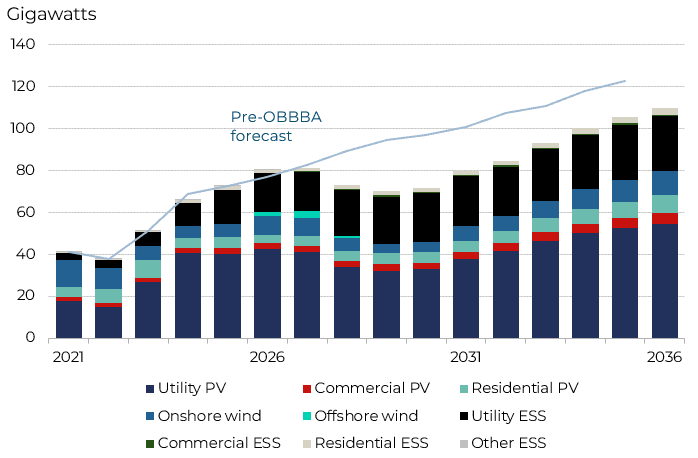
Yet the broader expansion has not stopped. BloombergNEF expects the US to add a record level of clean-energy capacity in 2026 and forecasts approximately 571GW of solar, 92GW of wind and 285GW of battery storage additions between 2026 and 2036. Despite the political rhetoric, deployment of new renewable energy assets continues to march on, a sign of a maturing market that can withstand external pressures. [US Clean Energy Market Outlook 1H 2026: Forces at Odds].
Figure 3: US clean energy build out
Source: BloombergNEF, 2026a US Clean Energy Market Outlook 1H 2026: Forces at Odds, 18 May 2026
The practical advantages of renewables conflict with policy
Recent deployment trends also suggest that renewables and storage retain important practical advantage over other generation sources. Solar projects can generally be developed more quickly than large conventional power plants, while rapid battery deployment is introducing flexibility into power markets and allowing more renewable electricity to be shifted into higher value evening hours. [US Green Energy Growth Is Proving Hard To Kill].
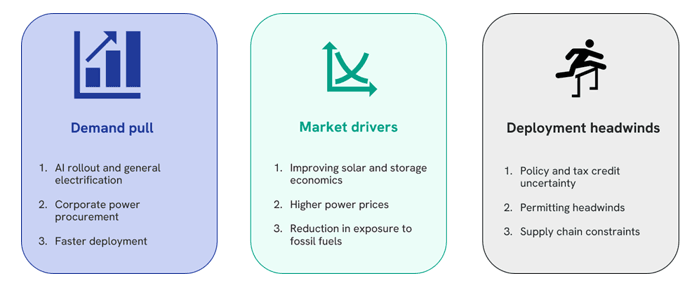
The market is therefore being shaped by forces pulling in opposite directions. On one hand, policy permitting, grid and supply-chain constraints make that capacity harder to deliver. On the other, electricity demand, time-to-power considerations, and improving technology economics continue to support new capacity.
In this environment, we believe that the market is moving away from indiscriminate, subsidy-led renewable capacity expansion and towards a more technology-agnostic and selective phase in which location, project economics and execution capability matter more.
Figure 4: Forces pulling US clean energy in opposite directions: Underlying demand remains strong, but a more difficult development environment is increasing the importance of project quality and execution.
Source: BloombergNEF, 2026a US Clean Energy Market Outlook 1H 2026: Forces at Odds, 18 May 2026
Capital must be married to expertise
The combination of rising demand and more difficult delivery conditions is changing what investors value when identifying investment opportunities across the energy transition.
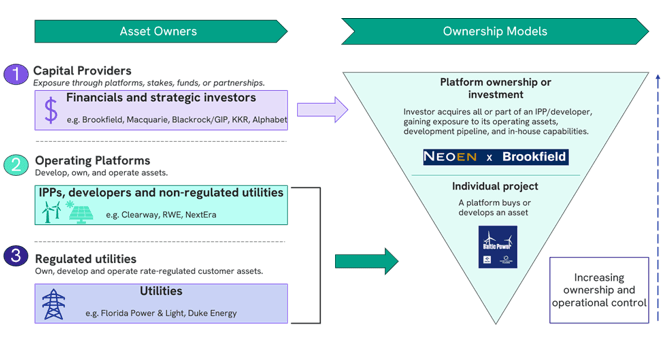
The US renewables market brings together several distinct types of owners. Financial investors, for example pension funds, such as La Caisse, and strategic investors, such as Alphabet, provide capital through funds, partnerships, minority stakes or acquisitions of entire platforms.
Operating platforms, including Independent Power Producers (IPPs) and developers, originate, develop, own and operate projects.
Regulated utilities also own and develop renewable assets, typically within their existing service territories and regulated investment frameworks.
Together, these groups own approximately 80% of the operational solar and onshore-wind capacity tracked by BloombergNEF and control about three-quarters of the development timeline [Who Owns US Renewable Energy].
Broadly, financial investors compete through balance-sheet scale and a low cost of capital, while operating platforms differentiate through development expertise and operational know-how. Regulated utilities sit between the two, combining financial strength with established customer, regulatory and network capabilities.
Figure 5: Who owns renewable capability?
Source: BloombergNEF, 2026b Welborn et al., Who Owns US Renewable Energy? Capital Chases Capability, 23 July 2026
The scarcity of supply has led to a focus on owners with expertise
With substantial capital already seeking exposure to power infrastructure, what determines where that capital can actually be deployed? In reality, the supply of credible projects and platforms capable of absorbing this capital at attractive returns is more limited. This scarcity in supply is increasing the strategic value of businesses that already control mature pipelines, viable interconnection positions, specialist teams and established routes to market. Capital is therefore concentrating around owners that can convert rising electricity demand into projects that are permitted, financed, connected and ultimately operational.
We therefore see particular value in businesses that combine financial capacity with development expertise and a well-developed project pipeline. These companies are best placed to bridge the gap between rising electricity demand and the supply of new power infrastructure.
Vertically integrated utilities are well placed for US power growth
Vertically integrated utilities are increasingly important because they sit across the electricity value chain. They can invest in generation, storage, transmission and distribution, while using established customer franchises and regulatory relationships to recover investment through regulated returns.
This gives selected utilities multiple ways to translate rising electricity demand into earnings growth. As grid constraints become more acute, they can benefit not only from building new generation, but also from owning and expanding the networks required to connect and deliver that power.
The opportunity is not uniform across the sector. Attractive returns still depend on constructive regulation, customer affordability, balance-sheet capacity and disciplined execution. The strongest investment cases are therefore likely to emerge where demand growth, attractive renewable resources and supportive regulation combine to create a sustained pipeline of investable projects.
How the Global Real Infrastructure Fund portfolio has adapted
The changing US power environment has led us to broaden how we access the energy transition. We have increased exposure to selected US utilities that own critical generation and grid infrastructure, while retaining our long-term weighting toward specialist independent power producers (IPPs) and renewable developers that provide a more direct route into new generation and storage development.
The two models offer different forms of exposure. Regulated utilities can translate rising demand into investment across generation and networks, with returns supported by regulated frameworks. IPPs originate, develop and operate projects and therefore offer greater direct exposure to power markets, project development and differentiated pipelines.
Across both, our investment analysis focuses on:
• the quality of regional electricity demand;
• renewable-resource availability;
• ownership of scarce grid infrastructure;
• the maturity and connectivity of development pipelines;
• the strength of regulatory frameworks;
• balance-sheet capacity;
• customer affordability; and
• the ability of management teams to execute complex capital programmes.
What are some stock examples which we believe will still create value
Xcel Energy: resource quality meets infrastructure ownership
A recent addition to the Global Real Infrastructure Fund’s portfolio, Xcel Energy illustrates the type of capability we believe will be increasingly valuable as US power demand grows. The company combines a strong operational track record with an attractive asset footprint and a visible pipeline of regulated investment, providing a credible route to translate rising electricity demand into asset and earnings growth.
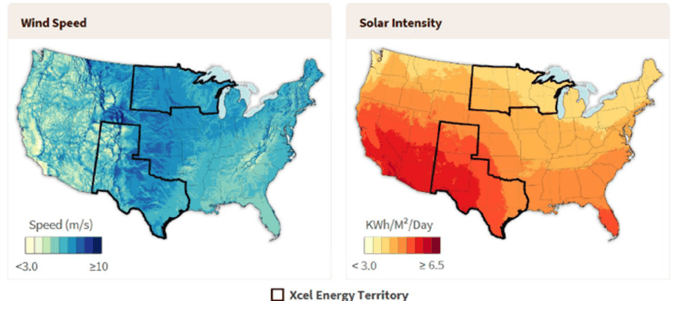
Xcel operates vertically integrated utilities across eight Midwestern and Southwestern states, owning generation, transmission and distribution infrastructure. Its service territories include some of the strongest wind resources in the Upper Midwest and attractive solar resources in the Southwest. This gives Xcel access to relatively low-cost renewable generation, while its existing networks, regulatory relationships and operating expertise provide the capability needed to bring those resources onto the system.
Regional advantage
Figure 6: Map Xcel’s territories against US wind-speed and solar-intensity resources
Source: Xcel Energy, Investor Presentation, March 2026
Xcel’s $60 billion capital programme through 2030 shows how these advantages can translate into growth. The programme includes significant investment in new generation and storage, with approximately 9.4GW of regulated renewable and storage development planned through the end of the decade.
Management has historically taken a relatively conservative approach to including projects within its capital plan, providing greater confidence in delivery while retaining potential upside as additional projects receive approval. [Xcel Energy, March 2026 Investor Presentation].
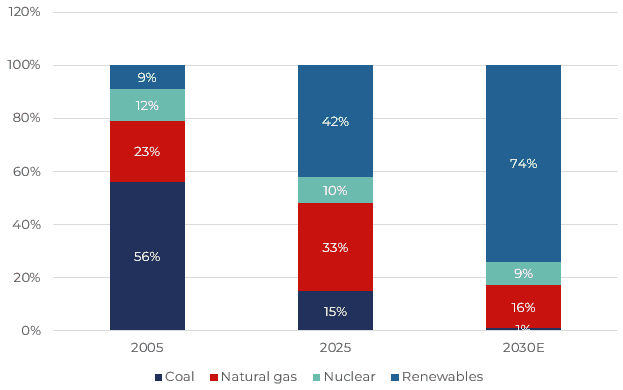
The resulting change in Xcel’s generation mix is significant. Coal accounted for approximately 56% of generation in 2005, falling to around 15% today and an expected 1% by 2030. Over the same period, renewables have risen from approximately 9% to 42% and are expected to account for around 74% of generation by the end of the decade. Natural gas remains part of the mix, helping provide flexibility and system balancing as renewable penetration increases.
Generation transition to more renewables by 2030
Figure 7: Xcel generation mix (%) in 2005, 2024/25 and 2030 target, highlighting the decline in coal and growth in renewables
Source: Xcel Energy (2025), Investor Presentation, December, p. 15; Xcel Energy (2026), Investor Presentation, March, p. 16.
Grenergy: development expertise meets a scalable pipeline
As an IPP, Grenergy illustrates the operating-platform side of our investment thesis. The company specialises in utility-scale solar and battery storage, with capabilities spanning project development, construction, contracting, procurement and asset rotation across Europe and South America. This gives the business more direct exposure to the development of new clean-energy capacity than a regulated utility.
The company’s competitive advantage lies in its ability to repeatedly convert a development pipeline into operating assets. Grenergy has established procurement relationships with major battery suppliers, uses contracted revenues to de-risk advanced projects and has demonstrated an ability to recycle capital through asset sales.
This capability is becoming increasingly valuable as storage plays a larger role in balancing renewable generation. Grenergy’s investment strategy is focused on hybrid solar and battery projects that can shift electricity into higher-value periods, while its substantial development pipeline provides further opportunities to deploy capital.
While Xcel can convert rising electricity demand into regulated generation and network investment, Grenergy provides more direct exposure to the development expertise required to originate, finance, contract and deliver new generation and storage capacity. In both cases, the underlying investment thesis is similar: attractive market conditions are most valuable when combined with the capability to turn them into operating assets.
Private-market activity provides supporting evidence of platform value
Recent acquisitions of other long-term Global Real Infrastructure holdings provide further evidence that private-market investors are placing value on these same capabilities.
Encavis, Innergex and Boralex each combined operating renewable assets with development pipelines, specialist teams and established regional positions. Buyers were therefore acquiring both operating asset cashflows and established platforms through which significant additional capital could be deployed.
Figure 8: Private capital buys platforms, not just projects
The transactions provide private-market validation of the same combination of capital, expertise and project pipeline that we are seeking through our listed investments. They reinforce our view that, as the power market becomes harder to develop into, the ability to originate and execute projects can carry significant value beyond the assets already in operation.
Investing in the next phase of US power growth
Rising electricity demand is creating a significant requirement for new power infrastructure, but demand alone will not determine investment returns. Grid constraints, permitting, financing and execution mean we believe value will increasingly accrue to companies with the assets, pipelines and expertise required to turn that demand into deliverable projects.
What does this mean for the Global Real Infrastructure Fund?
The Fund is positioned accordingly. We have increased exposure to selected vertically integrated US utilities, such as Xcel Energy, that can invest across generation and networks through regulated frameworks, while retaining specialist operating platforms such as Grenergy that provide more direct exposure to renewable and storage development. Across both, we are looking for the same underlying qualities: financial capacity, strong regional positioning, credible pipelines and proven execution capability – which should ultimately translate to sustained earnings growth.
Risk: The FP Foresight Global Real Infrastructure Fund and the Guinness Global Real Infrastructure (Lux) Fund are Equity funds. Investors should be willing and able to assume the risks of equity investing. The value of an investment and the income from it can fall as well as rise as a result of market and currency movement; you may not get back the amount originally invested. The Funds are actively managed with the UK CPI +3% used as a comparator benchmark only.
This is marketing communication. Please refer to the prospectus, supplement and KIID/KID for the funds, which contain full information on the risks and detailed information on their characteristics and objectives, before making any final investment decisions.
Disclaimer: This insight may provide information about Fund portfolios, including recent activity and performance and may contain facts relating to equity markets and our own interpretation. Any investment decision should take account of the subjectivity of the comments contained in this insight. This insight is provided for information only and all the information contained in it is believed to be reliable but may be inaccurate or incomplete; any opinions stated are honestly held at the time of writing but are not guaranteed. The contents of this insight should not therefore be relied upon. It should not be taken as a recommendation to make an investment in the Funds or to buy or sell individual securities, nor does it constitute an offer for sale.